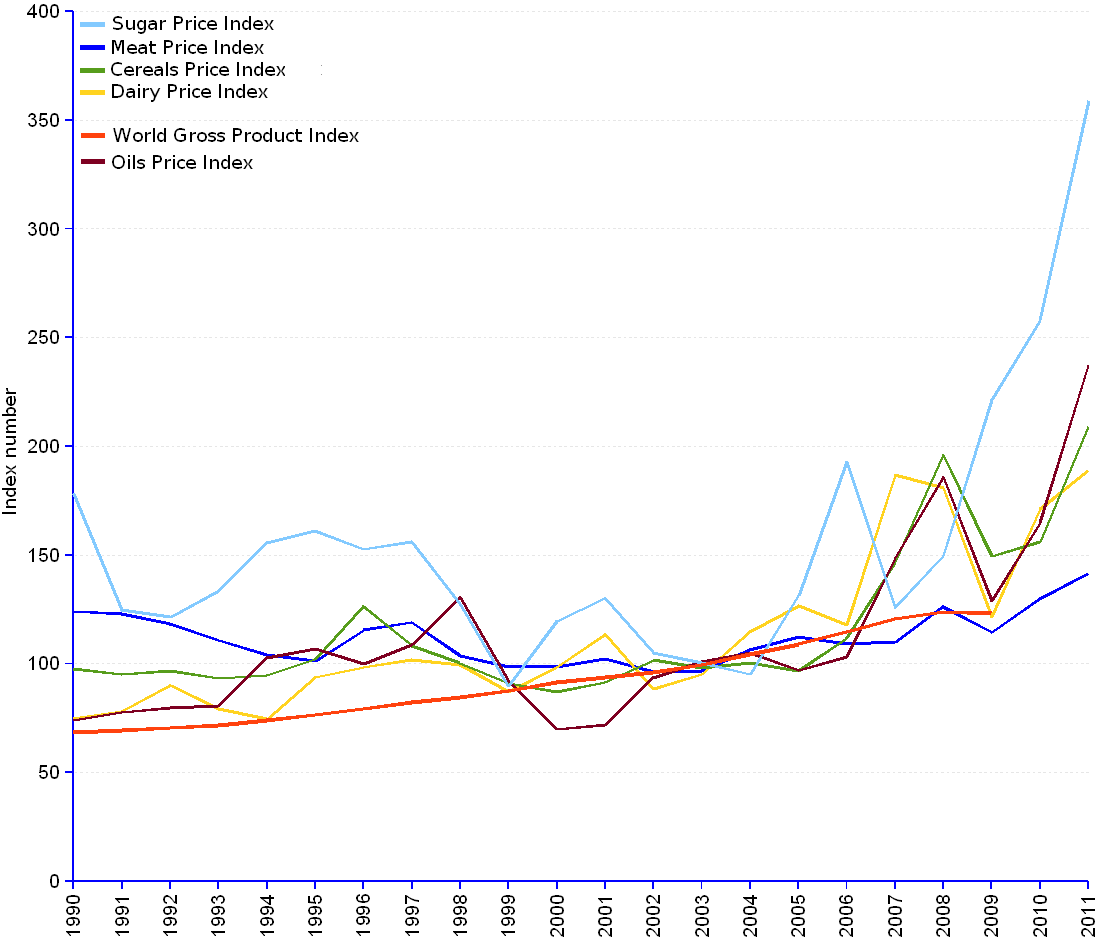

The 2010 blaze of food prices is driven mainly by the price increases of sugar, oils and cereals. The annual average growth rate for these commodities from 2003 through 2010 has been respectively 20%, 13% and 11%. Although price increases of dairy products (average growth rate 10%) and meat (average growth rate 5.6%) are significantly stronger than the growth of gross world product (about 3.6%), they are evidently weaker than those of the other three commodity groups.
What are the explanations for such differentials? Reliable answers would require further and deeper analysis. Nevertheless, it is relevant to note that cereals and sugar can be diverted to produce ethanol – an alcohol fuel that is currently blended with gasoline –, while vegetable oils can be transformed into bio diesel – a fuel that can be used in diesel engines –. Basic food staples are currently being taken away from our tables and pumped into our car tanks to substitute for scarce oil-derived fuels. This newer demand on food commodities contributes to the shortage of food and as a consequence feeds the process of price increase.
This is a realistic conjecture, according to the Organisation for Economic Co-operation and Development (OECD) ¹. In fact, OECD experts have assessed the impact of bio fuel support policies by the USA and the European Union (EU) in terms of the share of agricultural output diverted to bio fuels, and the effect on the world crop prices:
Maybe, in a not so far away future, a string of new food riots across the world will force us to face a crucial choice between using food to supply our cars or to supply our tables.
¹ Economic Assessment of Biofuel Support Policies, OECD Report, 2008.
Real Food Price Index¹ – Gross World Product (GWP) | |||||||
Year | Meat (Index) | Dairy (Index) | Cereals (Index) | Oils (Index) | Sugar (Index) | Gross World Product | |
| (Index) | Trillion US$ PPP ² | ||||||
| 1990 | 124.1 | 74.9 | 97.7 | 74.0 | 178.3 | 68.52 | 35,868 |
| 1991 | 123.0 | 78.1 | 95.1 | 77.6 | 124.8 | 69.43 | 36,342 |
| 1992 | 118.3 | 90.1 | 96.7 | 79.6 | 121.4 | 70.59 | 36,949 |
| 1993 | 110.8 | 79.3 | 93.3 | 80.6 | 133.4 | 71.83 | 37,599 |
| 1994 | 104.2 | 74.5 | 94.6 | 102.7 | 155.6 | 74.07 | 38,770 |
| 1995 | 101.3 | 93.7 | 102.1 | 106.9 | 161.2 | 76.45 | 40,018 |
| 1996 | 115.5 | 98.4 | 126.6 | 100.0 | 152.6 | 79.28 | 41,497 |
| 1997 | 119.1 | 101.6 | 108.3 | 108.8 | 156.0 | 82.42 | 43,144 |
| 1998 | 103.7 | 99.6 | 100.3 | 130.5 | 127.2 | 84.46 | 44,211 |
| 1999 | 98.6 | 87.0 | 91.0 | 92.3 | 89.7 | 87.51 | 45,805 |
| 2000 | 98.7 | 98.3 | 87.1 | 69.9 | 119.5 | 91.61 | 47,954 |
| 2001 | 102.4 | 113.6 | 91.5 | 71.7 | 130.1 | 93.64 | 49,016 |
| 2002 | 96.2 | 88.4 | 101.6 | 93.5 | 105.1 | 96.13 | 50,317 |
| 2003 | 96.7 | 95.1 | 98.0 | 100.8 | 100.5 | 99.48 | 52,072 |
| 2004 | 106.3 | 114.7 | 100.4 | 104.9 | 95.1 | 104.39 | 54,642 |
| 2005 | 112.4 | 126.6 | 96.7 | 96.9 | 131.2 | 109.07 | 57,092 |
| 2006 | 109.1 | 117.8 | 111.8 | 103.1 | 192.9 | 114.64 | 60,008 |
| 2007 | 110.0 | 186.7 | 146.7 | 148.7 | 125.7 | 120.6 | 63,128 |
| 2008 | 126.3 | 180.9 | 196.0 | 185.7 | 149.6 | 123.94 | 64,872 |
| 2009 | 114.3 | 121.7 | 149.4 | 129.0 | 221.3 | 123.12 | 64,448 |
| 2010 | 129.9 | 171.2 | 156.0 | 164.8 | 258.0 | ||
| 2011 | 141.7 | 189.0 | 209.1 | 237.2 | 358.9 | ||
| Average annual growth rate (2003-Jan.2011) | 5.61 % | 10.31 % | 11.43 % | 13 % | 19.94 % | 3.62 % (2003-2009) | 3.62 % (2003-2009) |
| ¹ Consists of the average of 5 commodity group price indices, inflation excluded, weighted with the average export shares of each of the groups for 2002-2004. The index for GWP has also a base of 2002-2004=100. | |||||||
| ² PPP GWP is gross world product converted to international dollars using purchasing power parity rates. An international dollar has the same purchasing power over GWP as the U.S. dollar has in the United States. GWP is given in constant 2005 international US dollars. | |||||||
Sources: see FaoStat-FAO for food prices, and World DataBank–The World Bank for gross world product data.