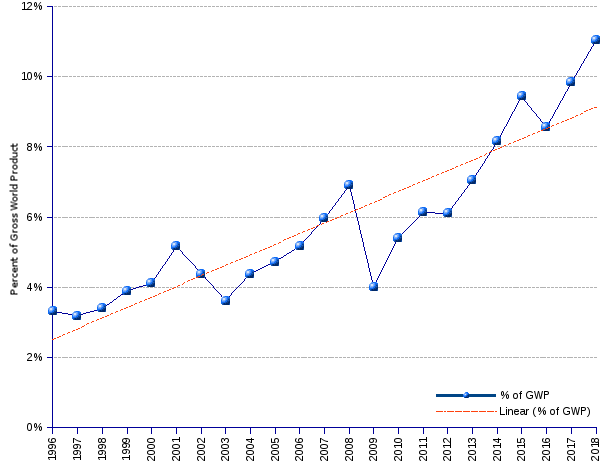
The weight of billionaire net worth in constant US$ relative to the Gross World Product (GWP) follows an upward path, moving from 3.3% in 1996 to a plush 11% in 2018. That means a plump annual average growth rate of 5.3% — twice as big as the 2.5% annual average growth of real GWP. What does it mean from the vantage point of the split of wealth between the richest and the commoners? To put it plainly, that says that, while the average person has to struggle with a shrinking income, or at best with one that hardly covers the inflation rate, billionaires can effectively deflect to their balance sheets a rapidly growing share of the world's output — indeed their cut increases annually almost 3 percent points faster than the world product.
Billionaire Net Worth as Percent of Gross World Product | ||||||||
Year ¹ |
World Billionaires |
GWP (gross world product) ² |
Billionaire Net Worth as percent of GWP |
|||||
| Number | Net Worth (billion US$ current) |
Net Worth (billion US$ constant, 2009=100) ³ |
Average (billion US$ constant, 2009=100) |
Median (billion US$ constant, 2009=100) |
(trillion US$ current) | (trillion US$ constant 2009=100) |
||
| 1996 | 423 | 1,049.5 | 1,580.3 | 3.7 | 2.9 | 31.71 | 47.7 | 3.31% |
| 1997 | 224 | 1,010.0 | 1,493.6 | 6.7 | 4.3 | 31.67 | 46.8 | 3.19% |
| 1998 | 209 | 1,069.1 | 1,554.4 | 7.4 | 4.8 | 31.49 | 45.8 | 3.40% |
| 1999 | 298 | 1,270.9 | 1,827.9 | 6.1 | 4.1 | 32.59 | 46.9 | 3.90% |
| 2000 | 322 | 1,386.1 | 1,963.6 | 6.1 | 4.1 | 33.65 | 47.7 | 4.12% |
| 2001 | 538 | 1,728.6 | 2,394.3 | 4.5 | 2.6 | 33.42 | 46.3 | 5.17% |
| 2002 | 472 | 1,515.5 | 2,052.3 | 4.3 | 2.4 | 34.56 | 46.8 | 4.39% |
| 2003 | 476 | 1,403.3 | 1,871.7 | 3.9 | 2.3 | 38.83 | 51.8 | 3.61% |
| 2004 | 587 | 1,917.2 | 2,507.1 | 4.3 | 2.5 | 43.71 | 57.2 | 4.39% |
| 2005 | 691 | 2,236.2 | 2,846.0 | 4.1 | 2.5 | 47.33 | 60.2 | 4.73% |
| 2006 | 793 | 2,645.5 | 3,261.9 | 4.1 | 2.5 | 51.26 | 63.2 | 5.16% |
| 2007 | 946 | 3,452.0 | 4,129.5 | 4.4 | 2.5 | 57.86 | 69.2 | 5.97% |
| 2008 | 1,125 | 4,381.0 | 5,105.0 | 4.5 | 2.6 | 63.46 | 73.9 | 6.90% |
| 2009 | 793 | 2,414.7 | 2,759.6 | 3.5 | 2.1 | 60.17 | 68.8 | 4.01% |
| 2010 | 1,011 | 3,567.8 | 4,046.7 | 2.3 | 4.0 | 65.95 | 74.8 | 5.41% |
| 2011 | 1,210 | 4,496.3 | 5,038.3 | 2.2 | 4.2 | 73.28 | 82.1 | 6.14% |
| 2012 | 1,226 | 4,574.5 | 5,022.2 | 4.1 | 2.3 | 74.89 | 82.2 | 6.11% |
| 2013 | 1,426 | 5,431.8 | 5,855.6 | 4.1 | 2.3 | 76.99 | 83.0 | 7.06% |
| 2014 | 1,645 | 6,446.5 | 6,839.0 | 4.2 | 2.3 | 79.05 | 83.9 | 8.16% |
| 2015 | 1,826 | 7,063.2 | 7,361.1 | 4.0 | 2.2 | 74.76 | 77.9 | 9.45% |
| 2016 | 1,810 | 6,482.6 | 6,683.5 | 3.7 | 2.1 | 75.85 | 78.2 | 8.55% |
| 2017 | 2,043 | 7,668.0 | 7,806.1 | 3.8 | 2.1 | 77.99 | 79.4 | 9.83% |
| 2018 | 2,208 | 9,059.6 | 9,059.6 | 4.1 | 2.2 | 81.96 | 82.0 | 11.05% |
| Average annual change rate | 7.8% | 9.9% | 7.9% | 0.1% | -1.4% | 4.4% | 2.5% | 5.3% |
| ¹ Year of publication of Forbes list of billionaires. ² Forbes estimates are a snapshot of billionaire wealth as of the beginning of the year. We therefore relate billionaires' wealth to GWP of the preceding year. ³ US$ constant (2009=100) are estimated by applying the US$ GDP deflator for the preceding year. | ||||||||
Sources: Forbes List of World Billionaires, International Monetary Fund, World Economic Outlook Database, and CIA World Factbook.