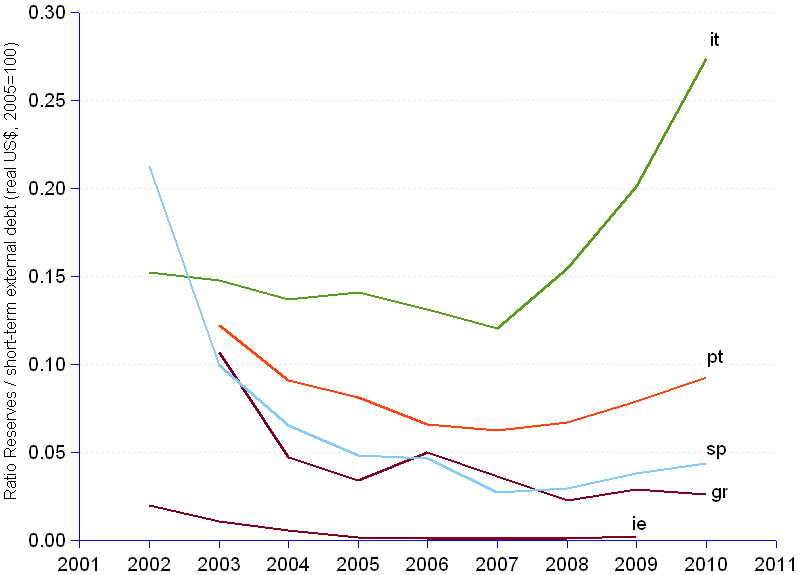
Compared to short term external debt, reserves, including gold reserves, amount to 27% in Italy, and a low 9% in Portugal, 4% in Spain, 3% in Greece and 0.3% in Ireland, as shown in the chart. This is bad news. Indeed, in 2000, the International Monetary Fund (IMF) presented the ratio of reserves to short term debt as a useful tool to "gauge risks associated with adverse developments in international capital markets."¹ To the question of ascertaining what should the right ratio be, the IMF stated that there was enough empirical evidence to support a benchmark of 1 (or 100%) for the ratio. According to such a premise, given PIIGS poor ratios, the risk of a liquidity crisis is extremely high for all of them.
The period has been marked by a regular erosion of the reserves (with the exception of Italy) which combines with a significant increase of short term debt to generate a dangerous downward trend of the ratio, decreasing at annual average rates between -4% (Portugal) and -21% (Ireland). This set of variations provides an indication that PIIGS liquidity, in other words the ability to meet short term debt obligations, is shrinking to alarming levels. This diagnosis requires a further test, provided by the ratio of short term debt to government revenue, or put simply, the country's ability to generate enough money through taxes to pay interests and amortization in a timely way.
Solvency ratios such as debt to exports and debt to GDP, measuring the country's capacity to generate enough resources to honor obligations towards external creditors, quite explicitly qualify PIIGS countries as high-risk debtors. Should they be unable, on top of that, to manage their liquidity to pay their short term bills, then it is legitimate to anticipate that external creditors will eventually impose on them a credit crunch capable of seriously crippling their economies and societies for a long while.
¹ Debt- and Reserve-Related Indicators of External Vulnerability, IMF, March 23, 2000.
Ratio of Reserves to Short Term External Debt | |||||||||||||||
Year¹ |
Portugal |
Ireland |
Italy |
Greece |
Spain |
||||||||||
| Short term external debt ² | Reserves ² | Reserves/ |
Short term external debt ² | Reserves ² | Reserves/ |
Short term external debt ² | Reserves ² | Reserves/ |
Short term external debt ² | Reserves ² | Reserves/ |
Short term external debt ² | Reserves ² | Reserves/ |
|
| 2002 | 19.2 | 298.5 | 5.9 | 0.020 | 397.2 | 60.4 | 0.15 | 10.2 | 206.2 | 43.8 | 0.21 | ||||
| 2003 | 111.6 | 13.6 | 0.12 | 421.6 | 4.4 | 0.010 | 454.8 | 67.2 | 0.15 | 57.7 | 6.2 | 0.11 | 287.6 | 28.5 | 0.10 |
| 2004 | 133.3 | 12.1 | 0.09 | 541.4 | 3.0 | 0.006 | 471.5 | 64.5 | 0.14 | 59.8 | 2.8 | 0.05 | 312.9 | 20.4 | 0.07 |
| 2005 | 128.1 | 10.4 | 0.08 | 599.2 | 0.9 | 0.001 | 469.5 | 66.0 | 0.14 | 67.1 | 2.3 | 0.03 | 356.7 | 17.2 | 0.05 |
| 2006 | 145.9 | 9.6 | 0.07 | 710.9 | 0.8 | 0.001 | 559.4 | 73.4 | 0.13 | 55.2 | 2.8 | 0.05 | 405.2 | 18.7 | 0.05 |
| 2007 | 173.2 | 10.8 | 0.06 | 852.0 | 0.9 | 0.001 | 736.1 | 88.5 | 0.12 | 94.5 | 3.4 | 0.04 | 656.0 | 17.9 | 0.03 |
| 2008 | 166.0 | 11.1 | 0.07 | 948.7 | 1.0 | 0.001 | 630.2 | 97.3 | 0.15 | 143.3 | 3.2 | 0.02 | 642.0 | 18.7 | 0.03 |
| 2009 | 183.8 | 14.4 | 0.08 | 876.7 | 2.0 | 0.002 | 597.4 | 120.0 | 0.20 | 175.7 | 5.0 | 0.03 | 681.6 | 25.6 | 0.04 |
| 2010 | 204.8 | 18.9 | 0.09 | 680.3 | 1.9 | 0.003 | 523.5 | 143.2 | 0.27 | 220.8 | 5.7 | 0.03 | 657.7 | 28.8 | 0.04 |
| 2011 | 180.7 | 592.0 | 604.7 | 233.2 | 687.3 | ||||||||||
| Avge annual change rate | 6.2% | -0.2% | -3.9% | 7.9% | -1.3% | -21.7% | 4.8% | 11.4% | 7.6% | 19.1% | -7.0% | -18.3% | 14.3% | -5.1% | -17.9% |
| ¹ All years show 4th Quarter values, except 2011 that is 3rd Quarter. | |||||||||||||||
| ² Billion real US$, 2005=100. | |||||||||||||||
Sources: JEDH for external debt, and World DataBank for reserves estimates.