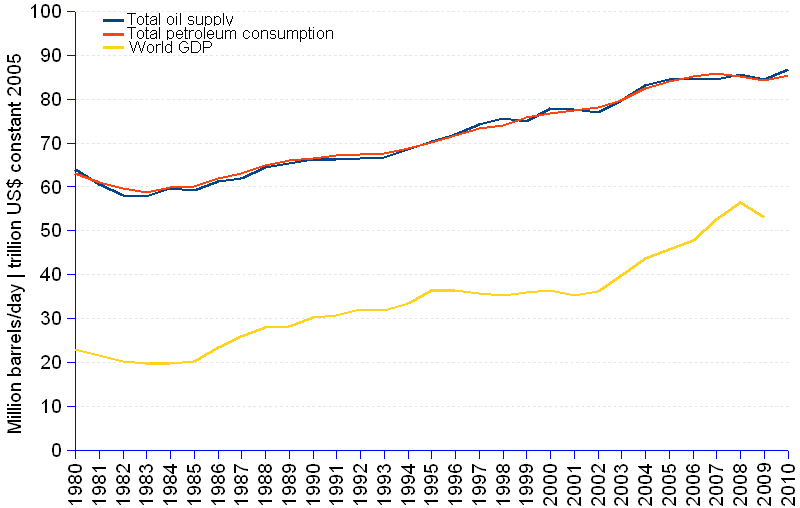

Trends in global oil supply and consumption suggest an ever-increasing demand on petroleum products, pulling oil production to increase steadily.
By relating oil supply and demand to world economic output, as measured by gross world product (GWP), one gets a plain confirmation of the obvious. GWP is strongly correlated to consumption (correlation coefficient 0.95) and to production (correlation coefficient 0.96). As GWP grows, at an annual average rate of 2.93% from 1980 to 2009, both production and consumption grow at a rate of respectively 1.02% and 1.01%. The Pearson R² statistic reiterates the close relationship between the two categories of variables. Ups and downs of oil production and consumption are explained to a large extent – 91% or 92% – by the ups and downs of economic activity.
The oil production and petroleum consumption lines are not perfectly coincidental, their average rates and correlation coefficients to GWP follow a common trend but have slightly different values. These differentials suggest that production precedes consumption in order to build stocks capable of preventing eventual supply bottlenecks.
The fact that GWP tends to grow faster than production or consumption suggests that technology advances have enabled modern industry to achieve efficiency gains allowing to obtain more heat and more mechanical energy from the same barrel of oil. It is not bad news. However, it is not enough. Oil reserves may last a bit, or a lot longer if we slow down the pace of pumping. Yet, the eventual outcome remains unaltered: sooner or later oil reserves will dry out. Doing a little or a lot more of the same will not erase the problem. Only a radical change is likely to prevent the gloomy closure. That can be a breakthrough in the development of new energy forms, or a dramatic change of the world's development model, or both preferably.
World Oil Balance | |||||
Year |
World oil supply¹ |
World petroleum²,³ consumption |
World gross domestic production (GDP) |
||
| Million barrels/day | Trillion US$ (constant 2005=100) |
||||
| 1980 | 64.0 | 63.1 | 23.0 | ||
| 1981 | 60.6 | 61.0 | 21.6 | ||
| 1982 | 58.1 | 59.6 | 20.1 | ||
| 1983 | 57.9 | 58.8 | 19.8 | ||
| 1984 | 59.6 | 59.8 | 19.8 | ||
| 1985 | 59.1 | 60.1 | 20.2 | ||
| 1986 | 61.4 | 61.8 | 23.4 | ||
| 1987 | 62.0 | 63.1 | 25.8 | ||
| 1988 | 64.3 | 65.0 | 27.9 | ||
| 1989 | 65.4 | 66.1 | 28.2 | ||
| 1990 | 66.3 | 66.5 | 30.3 | ||
| 1991 | 66.3 | 67.2 | 30.7 | ||
| 1992 | 66.4 | 67.4 | 32.1 | ||
| 1993 | 66.7 | 67.5 | 31.8 | ||
| 1994 | 68.6 | 68.9 | 33.5 | ||
| 1995 | 70.3 | 70.1 | 36.4 | ||
| 1996 | 71.9 | 71.7 | 36.5 | ||
| 1997 | 74.2 | 73.4 | 35.7 | ||
| 1998 | 75.7 | 74.1 | 35.2 | ||
| 1999 | 74.9 | 75.8 | 36.0 | ||
| 2000 | 77.8 | 76.8 | 36.3 | ||
| 2001 | 77.7 | 77.5 | 35.3 | ||
| 2002 | 77.0 | 78.2 | 36.1 | ||
| 2003 | 79.6 | 79.7 | 39.8 | ||
| 2004 | 83.1 | 82.5 | 43.6 | ||
| 2005 | 84.6 | 84.1 | 45.6 | ||
| 2006 | 84.7 | 85.2 | 47.9 | ||
| 2007 | 84.6 | 85.8 | 52.5 | ||
| 2008 | 85.6 | 85.2 | 56.5 | ||
| 2009 | 84.4 | 84.3 | 53.1 | ||
| 2010 | 86.8 | 85.3 | |||
| Annual average change rate | 1.02% | 1.01% | 2.93% | ||
| Correlation with GDP | 0.954 | 0.959 | |||
| R² statistic | 0.910 | 0.920 | |||
| ¹ Oil supply is defined as the production of crude oil (including lease condensate), natural gas plant liquids, and other liquids, and refinery processing gain or loss. | |||||
| ² Petroleum: A broadly defined class of liquid hydrocarbon mixtures. Included are crude oil, lease condensate, unfinished oils, refined petroleum products obtained from the processing of crude oil, and natural gas plant liquids. Volumes of finished petroleum products include nonhydrocarbon compounds, such as additives and detergents, after they have been blended into the products. | |||||
| ³ A 42-U.S. gallon barrel of crude oil provides about 45 gallons of petroleum products. The gain from processing is more than 6%. One barrel of crude oil, when refined, produces about 19 gallons of finished motor gasoline, and 10 gallons of diesel, as well as other petroleum products. Most petroleum products are used to produce energy. | |||||
Sources: EIA - Energy Information Administration and World DataBank - The World Bank.