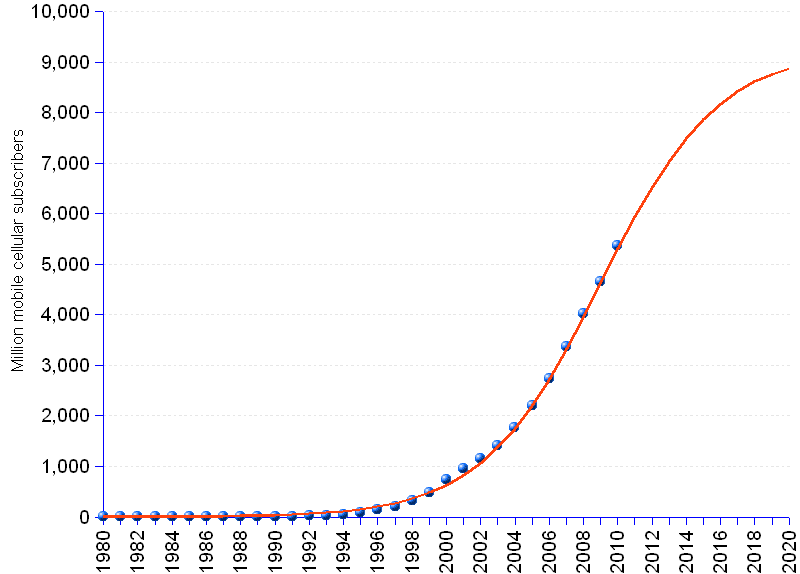

In 2010 there were 5.4 billion mobile subscribers worldwide, reports ITU (International Telecommunications Union). This averages almost 8 mobile phones for 10 people, or about 1 device per living person above 5 years of age.
With the advent of the newest generations of handsets, loaded with so many features that they can hardly be seen as close relatives of former mobile phones as we used to know them, on one hand and, on the other hand, the diffusion of cellular technology as a substitute for non-existent fixed lines in large emerging nations, it is likely that growth will continue for some time, although at slower rates.
Our new forecast (compare with 2008 forecast) based on ITU's data for 2010 (blue dots represent actual data; the red line is produced by a logistic growth function) anticipates a market size of 8.9 billion subscribers by 2020, corresponding to 116% of the projected world population, and close to saturation that could happen at 9.2 billion subscribers.
Mobile Cellular Phone Subscribers | ||
Year | Actual | Forecast ¹ |
| 1980 | 0.023 | 2.008 |
| 1981 | 0.064 | 2.685 |
| 1982 | 0.102 | 3.591 |
| 1983 | 0.149 | 4.803 |
| 1984 | 0.319 | 6.423 |
| 1985 | 0.751 | 8.588 |
| 1986 | 1.450 | 11.484 |
| 1987 | 2.545 | 15.353 |
| 1988 | 4.328 | 20.523 |
| 1989 | 7.353 | 27.43 |
| 1990 | 11.212 | 36.651 |
| 1991 | 16 | 48.955 |
| 1992 | 23 | 65.361 |
| 1993 | 34 | 87.213 |
| 1994 | 56 | 116.278 |
| 1995 | 91 | 154.865 |
| 1996 | 145 | 205.968 |
| 1997 | 215 | 273.426 |
| 1998 | 318 | 362.093 |
| 1999 | 490 | 477.979 |
| 2000 | 738 | 628.327 |
| 2001 | 961 | 821.531 |
| 2002 | 1,157 | 1,066.78 |
| 2003 | 1,417 | 1,373.29 |
| 2004 | 1,763 | 1,749.02 |
| 2005 | 2,207 | 2,198.79 |
| 2006 | 2,747 | 2,722.17 |
| 2007 | 3,370 | 3,311.51 |
| 2008 | 4,035 | 3,951.04 |
| 2009 | 4,650 | 4,617.80 |
| 2010 | 5,373 | 5,284.56 |
| 2011 | 5,924.08 | |
| 2012 | 6,513.42 | |
| 2013 | 7,036.80 | |
| 2014 | 7,486.57 | |
| 2015 | 7,862.30 | |
| 2016 | 8,168.81 | |
| 2017 | 8,414.06 | |
| 2018 | 8,607.27 | |
| 2019 | 8,757.61 | |
| 2020 | 8,873.50 | |
| ¹ logistic growth function | ||
Source: ITU International Telecommunications Union