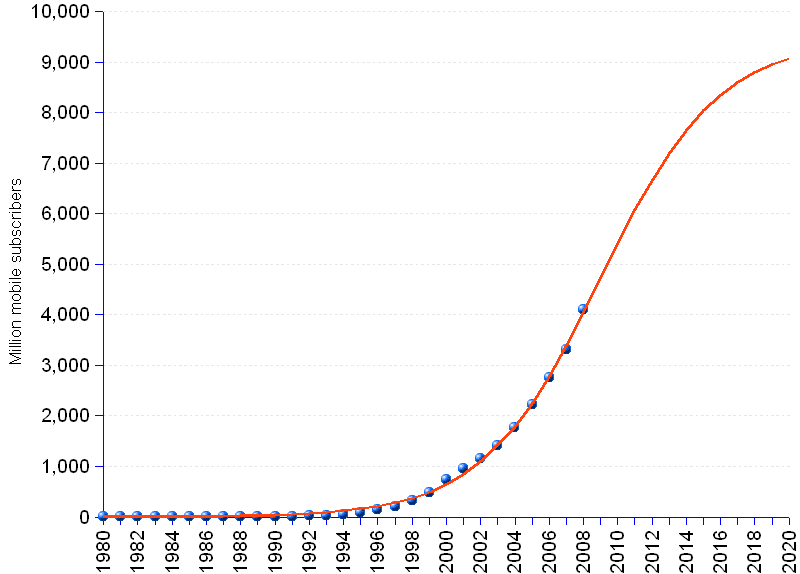

According to International Telecommunications Union (ITU), the 4 billion mobile subscriber mark was reached in 2008. Our forecasts suggest that the trend is approaching the inflection point. Within a few years, market growth will start decelerating to reach saturation at about 9.4 billion by 2025 (blue dots represent actual data; the red line is produced by a logistic growth function).
Mobile Cellular Phone Subscribers | ||
Year | Mobile subscribers | |
Actual | Forecast ¹ | |
| 1980 | 0.023482 | 2.087 |
| 1981 | 0.063585 | 2.789 |
| 1982 | 0.101509 | 3.728 |
| 1983 | 0.148855 | 4.983 |
| 1984 | 0.319252 | 6.66 |
| 1985 | 0.750629 | 8.9 |
| 1986 | 1.450136 | 11.894 |
| 1987 | 2.54527 | 15.892 |
| 1988 | 4.327956 | 21.232 |
| 1989 | 7.353071 | 28.36 |
| 1990 | 11.211543 | 37.871 |
| 1991 | 16 | 50.556 |
| 1992 | 23 | 67.459 |
| 1993 | 34 | 89.958 |
| 1994 | 56 | 119.866 |
| 1995 | 91 | 159.548 |
| 1996 | 145 | 212.068 |
| 1997 | 215 | 281.351 |
| 1998 | 318 | 372.357 |
| 1999 | 490 | 491.22 |
| 2000 | 738 | 645.326 |
| 2001 | 961 | 843.223 |
| 2002 | 1,157 | 1,094.26 |
| 2003 | 1,417 | 1,407.78 |
| 2004 | 1,763 | 1,791.86 |
| 2005 | 2,219 | 2,251.34 |
| 2006 | 2,757 | 2,785.74 |
| 2007 | 3,305 | 3,387.21 |
| 2008 | 4,100 | 4,039.70 |
| 2009 | 4,719.87 | |
| 2010 | 5,400.04 | |
| 2011 | 6,052.53 | |
| 2012 | 6,654.00 | |
| 2013 | 7,188.39 | |
| 2014 | 7,647.88 | |
| 2015 | 8,031.95 | |
| 2016 | 8,345.48 | |
| 2017 | 8,596.51 | |
| 2018 | 8,794.41 | |
| 2019 | 8,948.52 | |
| 2020 | 9,067.38 | |
| ¹ logistic growth function | ||
Source: ITU - Key Global Telecom Indicators.]