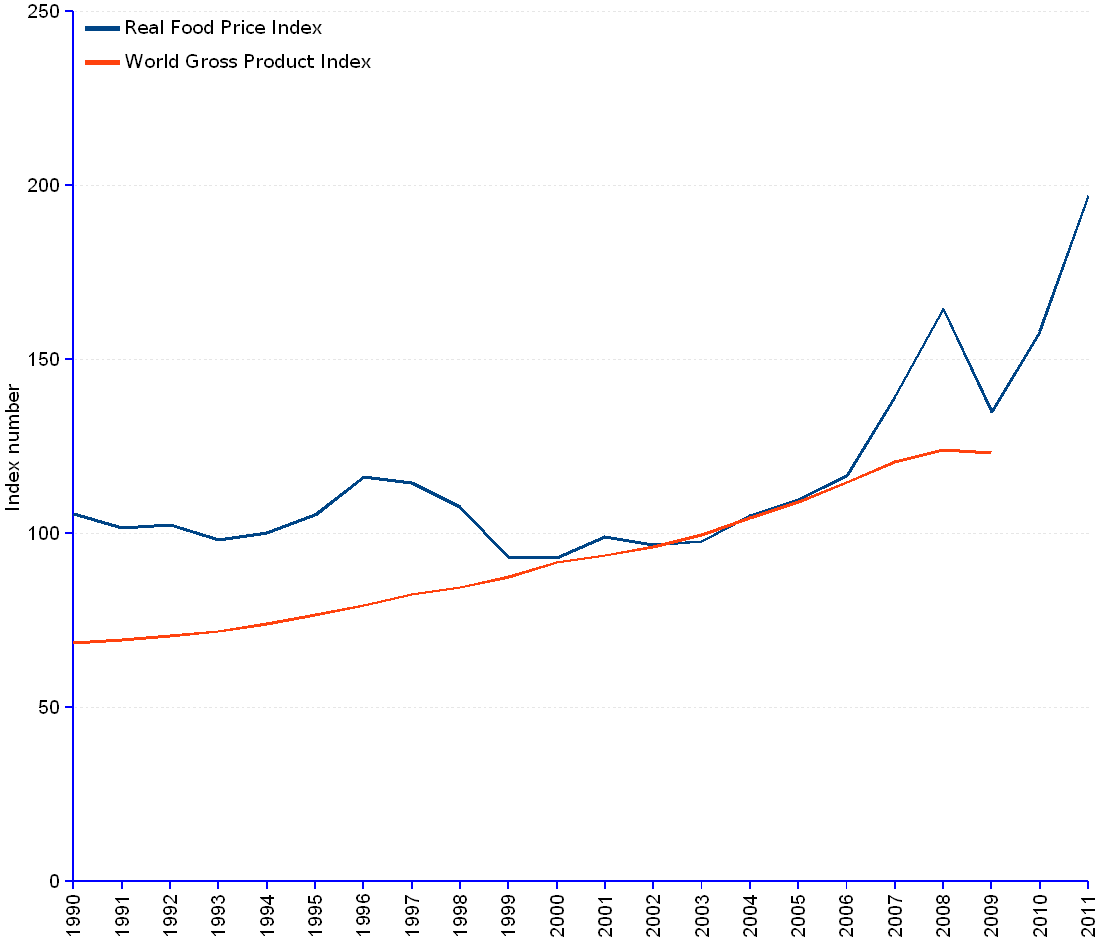

Real food prices – inflation excluded – (blue line) have reached historical heights, alerts the Food and Agriculture Organization of the United Nations (FAO). Meanwhile, an anemic gross world product (red line) shows little progress and is left far behind by price increases. The latter have been increasing roughly 3 times faster than gross product in the recent ten-year period.
Already in 2008, the World Food Summit had shown concern with the fever bout that took food prices to unprecedented spikes and triggered violent food riots in several countries. After an adjustment in 2009, prices caught fire again in 2010 and attained absolute highest levels in January 2011. Probable causes abound:
Short term price volatility has increased considerably since the price spike of 2008. However, whatever the short-term price movements may be, average crop prices over the next ten years will stay above the levels of the decade prior to the 2008 peak, say FAO and OECD experts. Current price levels are not a blip in the curve but a genuine upwards trend.
The heaviest impact will remain on the poor, especially in developing countries, with the world’s hungry now estimated at over 1 billion people. High food prices, falling yields of food crops, increasing crowds of undernourished people, growing numbers of unemployed, a wheezing world gross product engine, and an unstoppable inequality of income distribution, all these ingredients make an explosive cocktail. The spike in prices during the year 2008 was widely held as the reason for a series of "food riots" that erupted throughout Africa. If the same causes produce the same effects, one can expect further social and political disturbances if the prices of agricultural goods increase further.
Real Food Price Index¹ – Gross World Product (GWP) | |||
Year | Food Price Index | Gross World Product | |
Index | Trillion US$ PPP² (constant 2005 international $) | ||
| 1990 | 105.5 | 68.52 | 35,868 |
| 1991 | 101.6 | 69.43 | 36,342 |
| 1992 | 102.5 | 70.59 | 36,949 |
| 1993 | 98.1 | 71.83 | 37,599 |
| 1994 | 100.1 | 74.07 | 38,770 |
| 1995 | 105.3 | 76.45 | 40,018 |
| 1996 | 116.1 | 79.28 | 41,497 |
| 1997 | 114.5 | 82.42 | 43,144 |
| 1998 | 107.6 | 84.46 | 44,211 |
| 1999 | 93.1 | 87.51 | 45,805 |
| 2000 | 92.9 | 91.61 | 47,954 |
| 2001 | 99.0 | 93.64 | 49,016 |
| 2002 | 96.6 | 96.13 | 50,317 |
| 2003 | 97.7 | 99.48 | 52,072 |
| 2004 | 105.1 | 104.39 | 54,642 |
| 2005 | 109.7 | 109.07 | 57,092 |
| 2006 | 116.5 | 114.64 | 60,008 |
| 2007 | 139.4 | 120.6 | 63,128 |
| 2008 | 164.5 | 123.94 | 64,872 |
| 2009 | 134.9 | 123.12 | 64,448 |
| 2010 | 158.1 | ||
| 2011 | 197.1 | ||
| ¹ Consists of the average of 5 commodity group price indices, inflation excluded, weighted with the average export shares of each of the groups for 2002-2004. | |||
| ² PPP GWP is gross world product converted to international dollars using purchasing power parity rates. An international dollar has the same purchasing power over GWP as the U.S. dollar has in the United States. | |||
Sources: see FaoStat-FAO for food prices, and World DataBank–The World Bank for gross world product data.