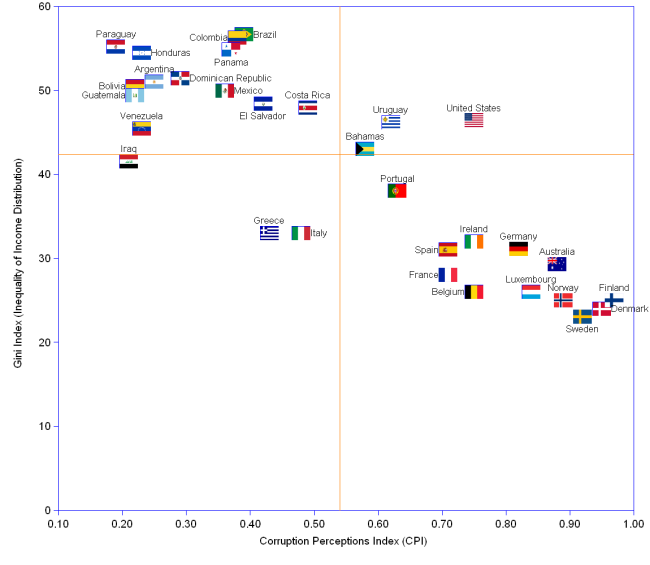
Corruption and inequality of income distribution seem strongly correlated. Corruption is measured by CPI (from 0.0 for highest, to 1.0 for lowest corruption), and inequality of income distribution by the Gini Index (from 0 for perfectly equalitarian, to 100 for totally inequalitarian). The orange vertical line indicates the median CPI, i.e. 0.54, and the orange horizontal line indicates the median Gini, i.e. 42.3.
[Values for Austria and Luxembourg being the same and overlapping, only one data point, Luxembourg, appears in the chart].
Relationship Between Corruption & Unequal Income Distribution ¹ | ||
Country |
Gini Index |
Corruption Perceptions Index (CPI) |
| Argentina | 51 | 0.25 |
| Australia | 29 | 0.88 |
| Austria | 26 | 0.84 |
| Bahamas | 43 | 0.58 |
| Belgium | 26 | 0.75 |
| Bolivia | 50 | 0.22 |
| Brazil | 57 | 0.39 |
| Colombia | 56 | 0.38 |
| Costa Rica | 48 | 0.49 |
| Denmark | 24 | 0.95 |
| Dominican Republic | 51 | 0.29 |
| El Salvador | 48 | 0.42 |
| Finland | 25 | 0.97 |
| France | 28 | 0.71 |
| Germany | 31 | 0.82 |
| Greece | 33 | 0.43 |
| Guatemala | 49 | 0.22 |
| Honduras | 54 | 0.23 |
| Iraq | 42 | 0.21 |
| Ireland | 32 | 0.75 |
| Italy | 33 | 0.48 |
| Luxembourg | 26 | 0.84 |
| Mexico | 50 | 0.36 |
| Norway | 25 | 0.89 |
| Panama | 55 | 0.37 |
| Paraguay | 55 | 0.19 |
| Portugal | 38 | 0.63 |
| Spain | 31 | 0.71 |
| Sweden | 23 | 0.92 |
| United States | 46 | 0.75 |
| Uruguay | 46 | 0.62 |
| Venezuela | 45 | 0.23 |
| Average | 39.88 | 0.56 |
| Median | 42.5 | 0.54 |
| Correlaqtion r = -0.85 | ||
| Regression R² = 0.72 | ||
| ¹ Data for 2004. Countries selected on the basis of data availability. | ||
Sources: Transparency International, World Income Inequality Database.