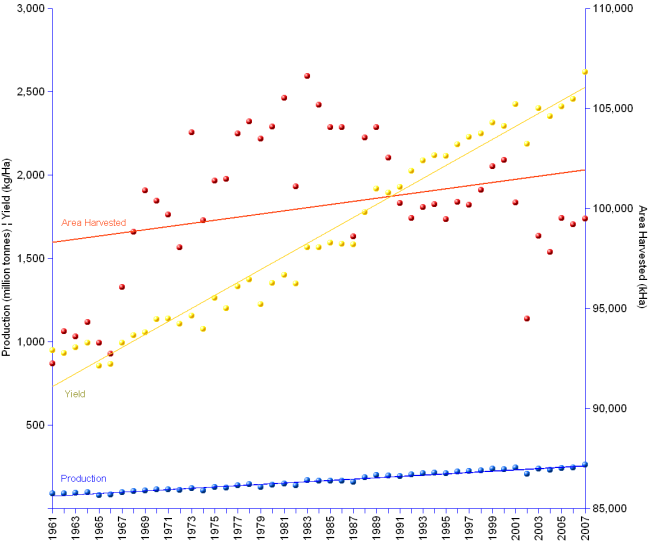

India has succeeded in keeping cereals total production and yields continuously growing from 1961 through 2007. However, yields at 2,619 kilogram/hectare are still modest compared with those of the world (3,380 kg/Ha), not to mention China (5,315 kg/Ha). India has also experienced difficulties with expanding areas harvested that, although 8% larger in 2007 than in 1961, have been shrinking since the peak of 106,613 thousand hectares in 1983. Modest yields and arable land limitations put a brake on effective production increases.
[Primary Y-axis: production in million metric tonnes, and yield in kilogram/hectare. Secondary Y-axis: area harvested in thousand hectares. Dots represent actual data, for which the corresponding regression lines are provided in the same colour.]
India | |||
Year | Area Harvested | Yield | Production |
| 1961 | 92,239 | 947 | 87 |
| 1962 | 93,852 | 930 | 87 |
| 1963 | 93,571 | 966 | 90 |
| 1964 | 94,306 | 994 | 94 |
| 1965 | 93,277 | 854 | 80 |
| 1966 | 92,730 | 864 | 80 |
| 1967 | 96,062 | 994 | 95 |
| 1968 | 98,823 | 1,037 | 102 |
| 1969 | 100,873 | 1,054 | 106 |
| 1970 | 100,377 | 1,135 | 114 |
| 1971 | 99,673 | 1,136 | 113 |
| 1972 | 98,044 | 1,108 | 109 |
| 1973 | 103,789 | 1,153 | 120 |
| 1974 | 99,389 | 1,074 | 107 |
| 1975 | 101,367 | 1,261 | 128 |
| 1976 | 101,465 | 1,199 | 122 |
| 1977 | 103,724 | 1,331 | 138 |
| 1978 | 104,340 | 1,370 | 143 |
| 1979 | 103,473 | 1,222 | 126 |
| 1980 | 104,067 | 1,350 | 140 |
| 1981 | 105,508 | 1,399 | 148 |
| 1982 | 101,084 | 1,346 | 136 |
| 1983 | 106,613 | 1,564 | 167 |
| 1984 | 105,176 | 1,564 | 164 |
| 1985 | 104,057 | 1,592 | 166 |
| 1986 | 104,049 | 1,585 | 165 |
| 1987 | 98,574 | 1,584 | 156 |
| 1988 | 103,543 | 1,776 | 184 |
| 1989 | 104,056 | 1,916 | 199 |
| 1990 | 102,537 | 1,891 | 194 |
| 1991 | 100,243 | 1,926 | 193 |
| 1992 | 99,500 | 2,025 | 201 |
| 1993 | 100,067 | 2,085 | 209 |
| 1994 | 100,184 | 2,116 | 212 |
| 1995 | 99,451 | 2,112 | 210 |
| 1996 | 100,300 | 2,181 | 219 |
| 1997 | 100,167 | 2,229 | 223 |
| 1998 | 100,904 | 2,248 | 227 |
| 1999 | 102,092 | 2,314 | 236 |
| 2000 | 102,402 | 2,294 | 235 |
| 2001 | 100,271 | 2,423 | 243 |
| 2002 | 94,471 | 2,187 | 207 |
| 2003 | 98,603 | 2,399 | 237 |
| 2004 | 97,806 | 2,350 | 230 |
| 2005 | 99,519 | 2,412 | 240 |
| 2006 | 99,199 | 2,456 | 244 |
| 2007 | 99,472 | 2,619 | 260 |
| Average change/year | 0.2% | 2.2% | 2.4% |
[]
Sources: see FAOSTAT.