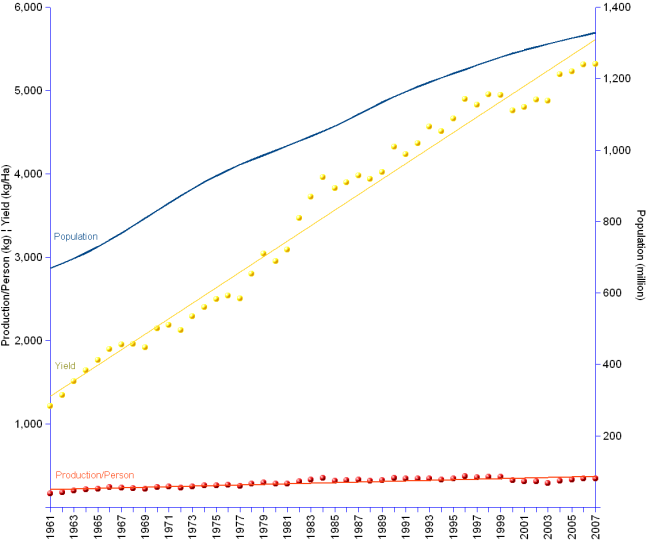

While China's population doubled from 1961 to 2007, cereals production yields increased more than four fold, from 1,211 kilogram/hectare in 1961 to 5,315 in 2007, at an annual average rate of 3.3%. This performance enabled production per capita to grow from 164 to 344 kilograms per person, at an annual average rate of 1.6%, slightly faster than population. However, the continuous progress of yields is not in line with the recorded slowdown of the production per person after 1996. Indeed, while yields grew at an average 1% per year after 1996, production per person went negative at an average -1%/year. Maybe "green revolution" technologies will not suffice to ensure the steady supply of cereals that is needed to protect the nation from hunger.
[Primary Y-axis: production per person in kilograms, and yield in kilogram/hectare. Secondary Y-axis: population in millions. Dots represent actual data, for which the corresponding regression lines are provided in the same colour.]
China | |||
Year | Population | Yield | Production/person |
| 1961 | 669 | 1,211 | 164 |
| 1962 | 682 | 1,342 | 176 |
| 1963 | 697 | 1,507 | 197 |
| 1964 | 712 | 1,640 | 214 |
| 1965 | 729 | 1,764 | 222 |
| 1966 | 748 | 1,895 | 238 |
| 1967 | 768 | 1,952 | 236 |
| 1968 | 789 | 1,958 | 225 |
| 1969 | 810 | 1,916 | 218 |
| 1970 | 831 | 2,143 | 242 |
| 1971 | 851 | 2,187 | 249 |
| 1972 | 872 | 2,122 | 237 |
| 1973 | 892 | 2,288 | 249 |
| 1974 | 910 | 2,402 | 258 |
| 1975 | 928 | 2,493 | 264 |
| 1976 | 944 | 2,537 | 265 |
| 1977 | 959 | 2,502 | 254 |
| 1978 | 972 | 2,802 | 281 |
| 1979 | 986 | 3,042 | 297 |
| 1980 | 999 | 2,949 | 281 |
| 1981 | 1,012 | 3,092 | 283 |
| 1982 | 1,025 | 3,465 | 308 |
| 1983 | 1,038 | 3,724 | 333 |
| 1984 | 1,052 | 3,961 | 348 |
| 1985 | 1,067 | 3,828 | 319 |
| 1986 | 1,083 | 3,895 | 325 |
| 1987 | 1,100 | 3,978 | 327 |
| 1988 | 1,117 | 3,937 | 315 |
| 1989 | 1,133 | 4,020 | 324 |
| 1990 | 1,149 | 4,323 | 352 |
| 1991 | 1,164 | 4,233 | 342 |
| 1992 | 1,177 | 4,366 | 343 |
| 1993 | 1,190 | 4,568 | 343 |
| 1994 | 1,202 | 4,510 | 330 |
| 1995 | 1,214 | 4,664 | 345 |
| 1996 | 1,226 | 4,897 | 370 |
| 1997 | 1,237 | 4,826 | 360 |
| 1998 | 1,249 | 4,954 | 367 |
| 1999 | 1,260 | 4,947 | 361 |
| 2000 | 1,270 | 4,756 | 321 |
| 2001 | 1,279 | 4,802 | 311 |
| 2002 | 1,288 | 4,890 | 310 |
| 2003 | 1,297 | 4,878 | 290 |
| 2004 | 1,305 | 5,190 | 317 |
| 2005 | 1,313 | 5,226 | 327 |
| 2006 | 1,321 | 5,313 | 343 |
| 2007 | 1,329 | 5,315 | 344 |
| Average change/year | 1.5% | 3.3% | 1.6% |
[]
Sources: see FAOSTAT for cereals production data, and United Nations Statistics Division for population data.