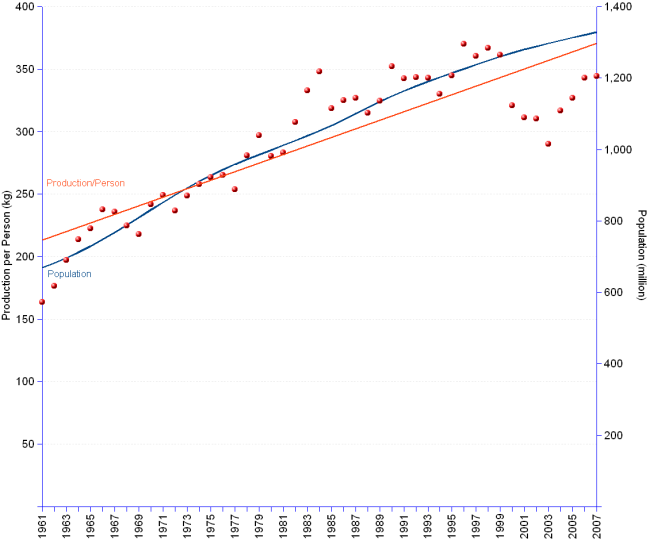

China made what can be properly labelled a "great leap forward" in terms of cereals production per capita. From a low 164 kilograms in 1961, production per person climbed to 344 kg in 2007, comparable to the world per capita of 352 kg. The annual average growth rate is 1.6%, higher than China's population growth rate of 1.5%. Nevertheless, the situation reversed during the last decade. In 2007, production per person was only 93% of the peak 370 kg reached in 1996. This means an annual average change rate of -1%. Other statistics suggest that this trend may be caused by the shrinkage of arable land and the shortage of freshwater.
[Primary Y-axis: per capita production in kilogram/person. Secondary Y-axis: population in millions. Dots represent actual data, for which the corresponding regression line is provided in the same colour.]
China | |||
Year | Population | Production | Production/person |
| 1961 | 669 | 110 | 164 |
| 1962 | 682 | 120 | 176 |
| 1963 | 697 | 137 | 197 |
| 1964 | 712 | 152 | 214 |
| 1965 | 729 | 162 | 222 |
| 1966 | 748 | 178 | 238 |
| 1967 | 768 | 181 | 236 |
| 1968 | 789 | 177 | 225 |
| 1969 | 810 | 176 | 218 |
| 1970 | 831 | 201 | 242 |
| 1971 | 851 | 212 | 249 |
| 1972 | 872 | 207 | 237 |
| 1973 | 892 | 222 | 249 |
| 1974 | 910 | 235 | 258 |
| 1975 | 928 | 245 | 264 |
| 1976 | 944 | 250 | 265 |
| 1977 | 959 | 243 | 254 |
| 1978 | 972 | 273 | 281 |
| 1979 | 986 | 293 | 297 |
| 1980 | 999 | 280 | 281 |
| 1981 | 1,012 | 286 | 283 |
| 1982 | 1,025 | 315 | 308 |
| 1983 | 1,038 | 346 | 333 |
| 1984 | 1,052 | 366 | 348 |
| 1985 | 1,067 | 340 | 319 |
| 1986 | 1,083 | 352 | 325 |
| 1987 | 1,100 | 359 | 327 |
| 1988 | 1,117 | 352 | 315 |
| 1989 | 1,133 | 368 | 324 |
| 1990 | 1,149 | 404 | 352 |
| 1991 | 1,164 | 398 | 342 |
| 1992 | 1,177 | 404 | 343 |
| 1993 | 1,190 | 408 | 343 |
| 1994 | 1,202 | 396 | 330 |
| 1995 | 1,214 | 419 | 345 |
| 1996 | 1,226 | 454 | 370 |
| 1997 | 1,237 | 446 | 360 |
| 1998 | 1,249 | 458 | 367 |
| 1999 | 1,260 | 455 | 361 |
| 2000 | 1,270 | 407 | 321 |
| 2001 | 1,279 | 398 | 311 |
| 2002 | 1,288 | 400 | 310 |
| 2003 | 1,297 | 376 | 290 |
| 2004 | 1,305 | 413 | 317 |
| 2005 | 1,313 | 429 | 327 |
| 2006 | 1,321 | 453 | 343 |
| 2007 | 1,329 | 457 | 344 |
| Average change/year | 1.5% | 3.2% | 1.6% |
[]
Sources: see FAOSTAT for cereals production data, and United Nations Statistics Division for population data.