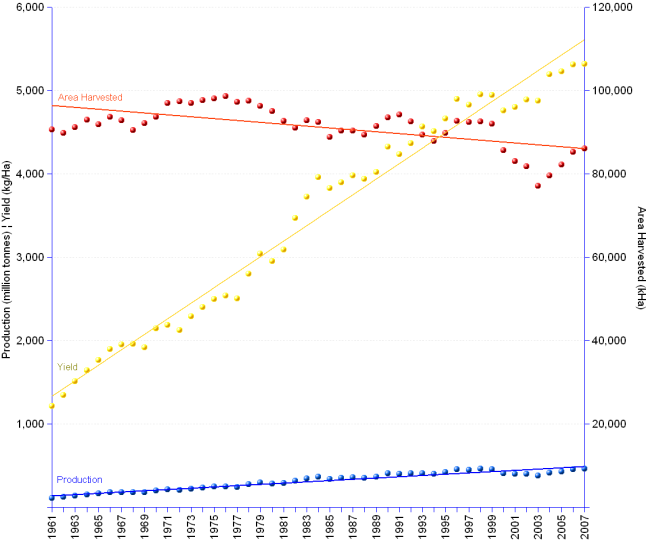

China put forth a fine performance in cereals production. Yields grew 4.4 times, from 1,211 kilogram/hectare in 1961 to 5,315 in 2007, at an annual average rate of 3.3%. Such a productivity gain allowed production to grow four fold, from 110 million tonnes in 1961 to 457 in 2007, at an annual change average rate of 3.2%. However, production peaked in 1998, with an output of 458 million tonnes and, in spite of continuing yield improvement, it remained hesitant during the last ten years. A possible explanation is that arable land is disappearing, as suggested by the shrinking surface of harvested areas. Indeed, the latter grew from 90,553 thousand hectares in 1961 to a peak of 98,627 in 1976, only to lose 13 percent points since then, with a low 86,060 thousand hectares in 2007.
[Primary Y-axis: production in million metric tonnes, and yield in kilogram/hectare. Secondary Y-axis: area harvested in thousand hectares. Dots represent actual data, for which the corresponding regression lines are provided in the same colour.]
China | |||
Year | Area Harvested | Yield | Production |
| 1961 | 90,553 | 1,211 | 110 |
| 1962 | 89,762 | 1,342 | 120 |
| 1963 | 91,217 | 1,507 | 137 |
| 1964 | 92,897 | 1,640 | 152 |
| 1965 | 91,910 | 1,764 | 162 |
| 1966 | 93,713 | 1,895 | 178 |
| 1967 | 92,807 | 1,952 | 181 |
| 1968 | 90,488 | 1,958 | 177 |
| 1969 | 92,117 | 1,916 | 176 |
| 1970 | 93,712 | 2,143 | 201 |
| 1971 | 96,997 | 2,187 | 212 |
| 1972 | 97,317 | 2,122 | 207 |
| 1973 | 96,958 | 2,288 | 222 |
| 1974 | 97,682 | 2,402 | 235 |
| 1975 | 98,094 | 2,493 | 245 |
| 1976 | 98,627 | 2,537 | 250 |
| 1977 | 97,256 | 2,502 | 243 |
| 1978 | 97,446 | 2,802 | 273 |
| 1979 | 96,233 | 3,042 | 293 |
| 1980 | 95,054 | 2,949 | 280 |
| 1981 | 92,653 | 3,092 | 286 |
| 1982 | 91,008 | 3,465 | 315 |
| 1983 | 92,801 | 3,724 | 346 |
| 1984 | 92,388 | 3,961 | 366 |
| 1985 | 88,792 | 3,828 | 340 |
| 1986 | 90,393 | 3,895 | 352 |
| 1987 | 90,300 | 3,978 | 359 |
| 1988 | 89,373 | 3,937 | 352 |
| 1989 | 91,447 | 4,020 | 368 |
| 1990 | 93,555 | 4,323 | 404 |
| 1991 | 94,139 | 4,233 | 398 |
| 1992 | 92,596 | 4,366 | 404 |
| 1993 | 89,308 | 4,568 | 408 |
| 1994 | 87,905 | 4,510 | 396 |
| 1995 | 89,770 | 4,664 | 419 |
| 1996 | 92,643 | 4,897 | 454 |
| 1997 | 92,403 | 4,826 | 446 |
| 1998 | 92,530 | 4,954 | 458 |
| 1999 | 92,012 | 4,947 | 455 |
| 2000 | 85,640 | 4,756 | 407 |
| 2001 | 82,961 | 4,802 | 398 |
| 2002 | 81,805 | 4,890 | 400 |
| 2003 | 77,111 | 4,878 | 376 |
| 2004 | 79,612 | 5,190 | 413 |
| 2005 | 82,167 | 5,226 | 429 |
| 2006 | 85,216 | 5,313 | 453 |
| 2007 | 86,060 | 5,315 | 457 |
| Average change/year | -0.1% | 3.3% | 3.2% |
[]
Sources: see FAOSTAT.