areppim: information, pure and simple

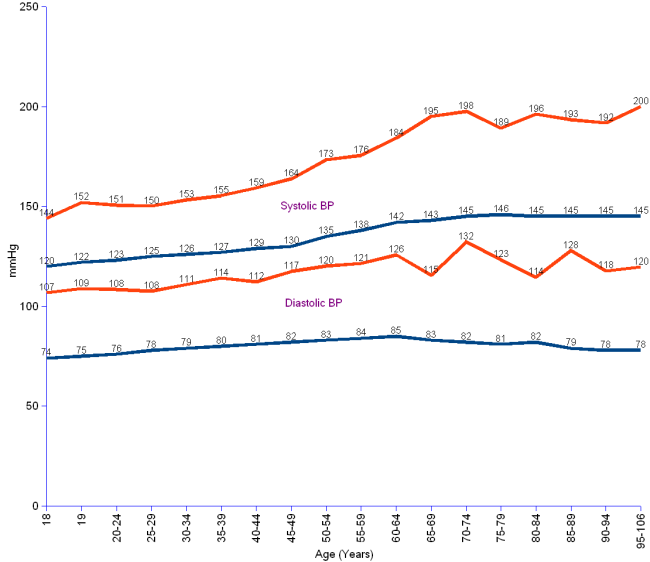
BP (blood pressure) levels for men by age. The upper two curves correspond to the mean (blue line) and the hypertension threshold (red line) for SBP (systolic blood pressure). The lower ones show the mean (blue line) and the hypertension threshold (red line) values for DBP (diastolic blood pressure). For currently prevailing recommendations, please refer to the Blood Pressure Guidelines.
| Age (Year) | Systolic BP (mmHg) | Diastolic BP (mmHg) | ||
|---|---|---|---|---|
| Mean value | Hypertension threshold | Mean value | Hypertension threshold | |
| 18 | 120 | 144 | 74 | 107 |
| 19 | 122 | 152 | 75 | 109 |
| 20-24 | 123 | 151 | 76 | 108 |
| 25-29 | 125 | 150 | 78 | 108 |
| 30-34 | 126 | 153 | 79 | 111 |
| 35-39 | 127 | 155 | 80 | 114 |
| 40-44 | 129 | 159 | 81 | 112 |
| 45-49 | 130 | 164 | 82 | 117 |
| 50-54 | 135 | 173 | 83 | 120 |
| 55-59 | 138 | 176 | 84 | 121 |
| 60-64 | 142 | 184 | 85 | 126 |
| 65-69 | 143 | 195 | 83 | 115 |
| 70-74 | 145 | 198 | 82 | 132 |
| 75-79 | 146 | 189 | 81 | 123 |
| 80-84 | 145 | 196 | 82 | 114 |
| 85-89 | 145 | 193 | 79 | 128 |
| 90-94 | 145 | 192 | 78 | 118 |
| 95-106 | 145 | 200 | 78 | 120 |