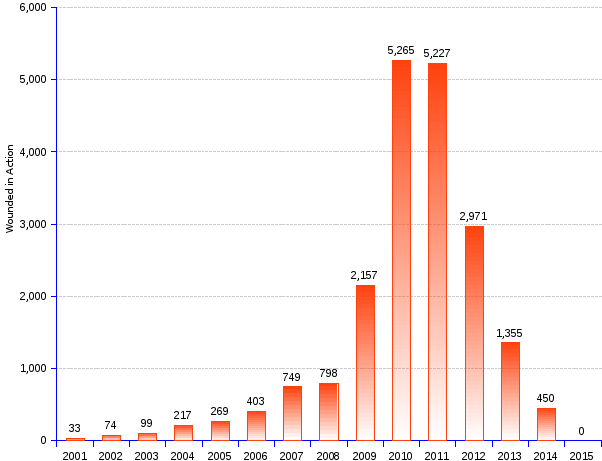

The number of wounded is not reported by NATO, but the US Department of Defense indicates that 450 US military were injured in 2014, January to December, bringing the total of wounded in action up to 20,067 since the beginning of the war.
The number of US wounded in action increased year-on-year since the beginning of the war in 2001, to reach a peak of 5,265 in 2010. Then the trend changed direction, registered a slight decline in 2011, and took the downward path thereafter. The ratio of wounded to killed rose from 3 in 2001 to 10.6 in 2010, in the heat of the strong US offensive named 'surge', reaching its highest mark of 12.6 in 2011, and keeping high through 2014.
The overall 8.5 wounded/killed ratio in the Afghanistan war is 3-fold to 7-fold higher than for all other US principal wars, exception made of the Iraq war with a 7.2 ratio. Such ratios provide a grim evidence of the savagery and the brutishness of the conflict. The ghastly nature of the Iraq and Afghanistan wars is sadly illustrated by the details available from the Department of Defense concerning some categories of casualties among military personnel in Afghanistan and Iraq:
Such high ratios bring to memory Chairman Mao's teaching that it is better to wound than to kill an enemy: one killed means one loss, one injured means several people tied up and unable to fight. The bottom line is that US troopers paid a heavy price throughout the 13-year long war — the longest ever engaged by the United States — against Afghan fighters, to end up with just one more US military defeat.
Afghanistan War | |||
Year | WIA | Killed | Ratio Wound/Kill |
| 2001 | 33 | 11 | 3.0 |
| 2002 | 74 | 49 | 1.5 |
| 2003 | 99 | 45 | 2.2 |
| 2004 | 217 | 52 | 4.2 |
| 2005 | 269 | 98 | 2.7 |
| 2006 | 403 | 98 | 4.1 |
| 2007 | 749 | 117 | 6.4 |
| 2008 | 798 | 155 | 5.1 |
| 2009 | 2,157 | 311 | 6.9 |
| 2010 | 5,265 | 499 | 10.6 |
| 2011 | 5,227 | 415 | 12.6 |
| 2012 | 2,971 | 313 | 9.5 |
| 2013 | 1,355 | 132 | 10.3 |
| 2014 | 450 | 57 | 7.9 |
| 2015 | 0 | 0 | |
| Total | 20,067 | 2,352 | 8.5 |
Other US Principal Wars | |||
| Iraq War | 31,949 | 4,412 | 7.2 |
| Persian Gulf | 467 | 383 | 1.2 |
| Vietnam | 153,303 | 58,220 | 2.6 |
| Korea | 103,284 | 36,574 | 2.8 |
| World War II | 670,846 | 405,399 | 1.7 |
| World War I | 204,002 | 116,516 | 1.8 |
Sources: US DoD - Defense Casualty Analysis System.