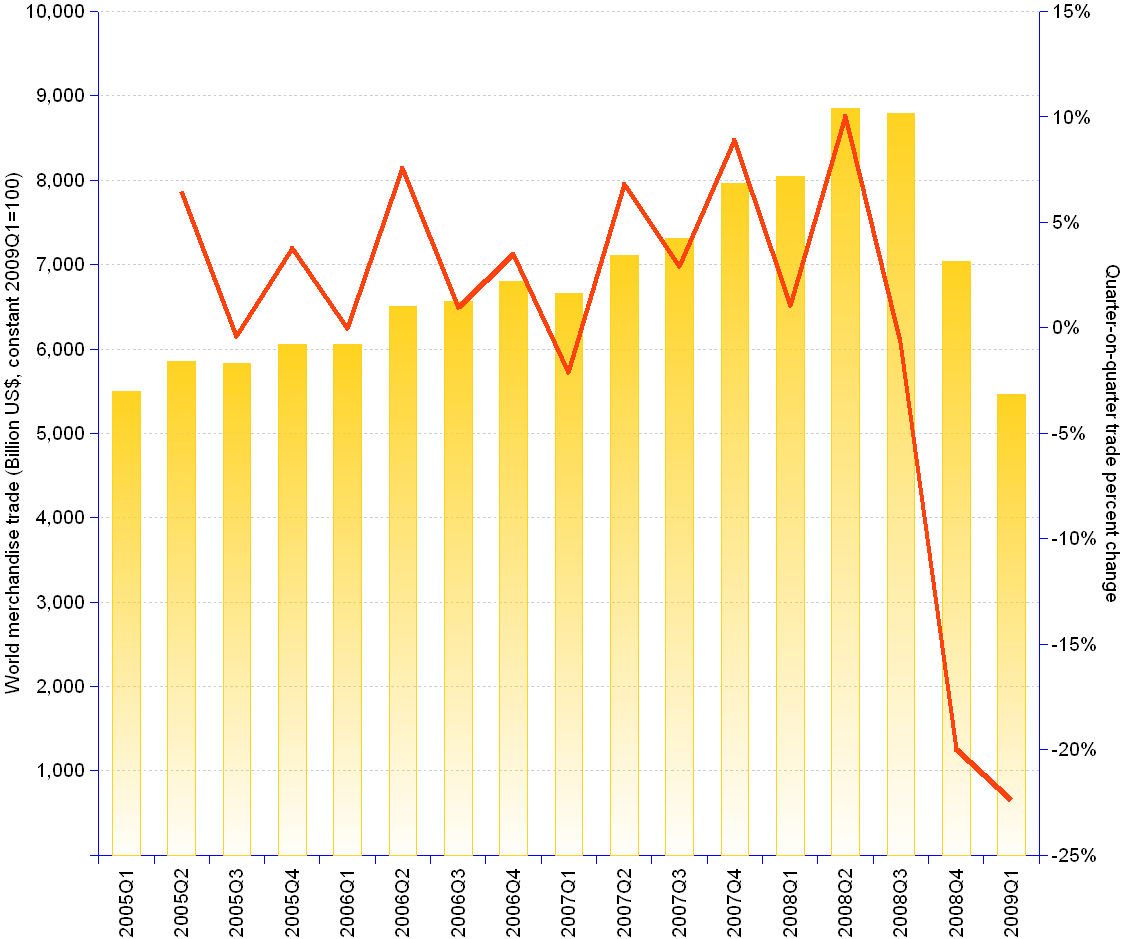

Quarterly world merchandise trade (columns, scale at left Y-axis) suffered a setback in Q3 2008. The fourth quarter of 2008 and the first quarter of 2009 registered appalling performances, with a quarter-on-quarter trade percent change of -20% and -22% (red line, scale at right Y-axis). The contraction mirrors the magnitude and depth of the current world economy crisis.
Quarterly World Merchandise Exports and Imports | |||||
Quarter | Exports | Imports | Total | % change | GDP deflator |
| Billion US$ (constant 2009Q1=100) | |||||
| 2005 Q1 | 2,697 | 2,802 | 5,500 | 111.77 | |
| 2006 Q2 | 2,875 | 2,979 | 5,854 | 6.5% | 112.35 |
| 2007 Q3 | 2,867 | 2,965 | 5,831 | -0.4% | 113.47 |
| 2008 Q4 | 2,980 | 3,070 | 6,050 | 3.7% | 114.53 |
| 2006 Q1 | 2,979 | 3,069 | 6,047 | 0.0% | 115.53 |
| 2006 Q2 | 3,206 | 3,299 | 6,505 | 7.6% | 116.32 |
| 2006 Q3 | 3,242 | 3,326 | 6,568 | 1.0% | 117.11 |
| 2006 Q4 | 3,359 | 3,437 | 6,797 | 3.5% | 117.73 |
| 2007 Q1 | 3,275 | 3,377 | 6,652 | -2.1% | 118.96 |
| 2007 Q2 | 3,510 | 3,593 | 7,102 | 6.8% | 119.55 |
| 2007 Q3 | 3,608 | 3,701 | 7,309 | 2.9% | 120 |
| 2007 Q4 | 3,942 | 4,019 | 7,960 | 8.9% | 120.74 |
| 2008 Q1 | 3,982 | 4,061 | 8,043 | 1.0% | 121.51 |
| 2008 Q2 | 4,391 | 4,458 | 8,849 | 10.0% | 121.89 |
| 2008 Q3 | 4,340 | 4,447 | 8,788 | -0.7% | 123.06 |
| 2008 Q4 | 3,444 | 3,589 | 7,032 | -20.0% | 123.24 |
| 2009 Q1 | 2,673 | 2,784 | 5,457 | -22.4% | 124.1 |
Sources: see WTO for merchandise trade data, and BEA for GDP deflator.