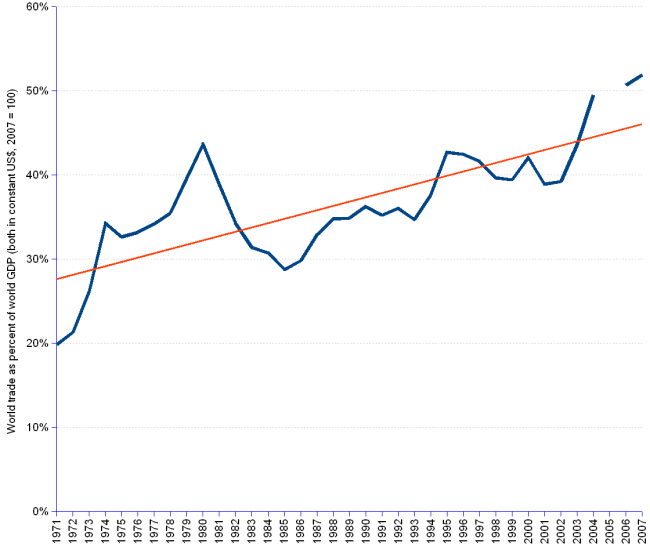
From 1971 to 2007, world merchandise trade grew at an average annual growth rate of 6.4% (doubling period 11 years) against 3.6% for GDP (doubling period 19 years). The blue line shows the yearly percent values; the line of fit in red is obtained by linear regression. Its steep upward trend evidences the increasing role of the world trade in the global economy.
World Merchandise Trade as percent of GDP | |||
Year |
World Trade |
World Gross Product |
World Trade as % of GDP |
| 1971 | 2,983,900 | 15,047,582 | 20% |
| 1972 | 3,384,049 | 15,886,090 | 21% |
| 1973 | 4,420,352 | 16,884,344 | 26% |
| 1974 | 5,869,173 | 17,121,763 | 34% |
| 1975 | 5,640,514 | 17,300,454 | 33% |
| 1976 | 6,015,243 | 18,132,865 | 33% |
| 1977 | 6,443,137 | 18,850,509 | 34% |
| 1978 | 6,978,378 | 19,664,034 | 35% |
| 1979 | 8,108,159 | 20,466,059 | 40% |
| 1980 | 9,109,856 | 20,862,282 | 44% |
| 1981 | 8,260,796 | 21,257,504 | 39% |
| 1982 | 7,304,409 | 21,325,655 | 34% |
| 1983 | 6,864,793 | 21,878,560 | 31% |
| 1984 | 7,030,811 | 22,874,149 | 31% |
| 1985 | 6,821,535 | 23,751,997 | 29% |
| 1986 | 7,304,992 | 24,526,862 | 30% |
| 1987 | 8,345,018 | 25,389,202 | 33% |
| 1988 | 9,233,053 | 26,571,108 | 35% |
| 1989 | 9,607,426 | 27,569,354 | 35% |
| 1990 | 10,278,125 | 28,362,020 | 36% |
| 1991 | 10,142,162 | 28,806,602 | 35% |
| 1992 | 10,606,389 | 29,433,375 | 36% |
| 1993 | 10,381,767 | 29,941,242 | 35% |
| 1994 | 11,621,989 | 30,951,199 | 38% |
| 1995 | 13,591,271 | 31,841,142 | 43% |
| 1996 | 13,978,023 | 32,942,787 | 42% |
| 1997 | 14,227,632 | 34,188,303 | 42% |
| 1998 | 13,890,270 | 35,037,909 | 40% |
| 1999 | 14,241,831 | 36,125,898 | 39% |
| 2000 | 15,795,343 | 37,557,523 | 42% |
| 2001 | 14,832,055 | 38,142,310 | 39% |
| 2002 | 15,221,521 | 38,840,684 | 39% |
| 2003 | 17,395,188 | 39,904,986 | 44% |
| 2004 | 20,566,250 | 41,536,581 | 50% |
| 2005 | 22,622,512 | ||
| 2006 | 25,201,451 | 49,766,113 | 51% |
| 2007 | 28,194,000 | 54,347,038 | 52% |
[ ]
Sources: see WTO