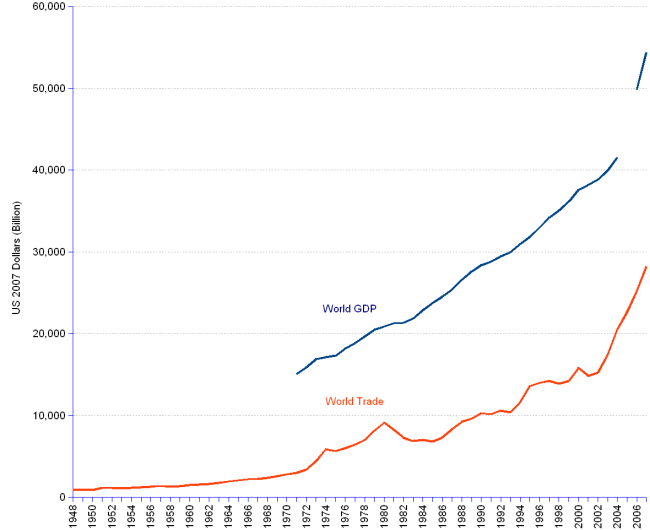
In 2007, world merchandise trade grew by 9.2% over the preceding year in constant dollars of 2007, reaching a total of 28,194 billion, or 52% of the world GDP estimated at 54,347 billion. From 1948 to 2007, trade grew at an average annual growth rate of 6.1% (resulting in the doubling in size every 12 years).
World Merchandise Trade & GDP Compared | ||||
| (Million constant US$ - 2007=100) | ||||
Year |
Exports |
Imports |
World Trade |
World Gross Product |
| 1948 | 424,205 | 453,461 | 877,666 | |
| 1949 | 439,638 | 461,620 | 901,258 | |
| 1950 | 449,373 | 463,869 | 913,243 | |
| 1951 | 568,041 | 595,090 | 1,163,131 | |
| 1952 | 545,162 | 585,052 | 1,130,214 | |
| 1953 | 551,693 | 558,261 | 1,109,955 | |
| 1954 | 565,998 | 579,010 | 1,145,008 | |
| 1955 | 607,294 | 632,865 | 1,240,159 | |
| 1956 | 648,723 | 673,436 | 1,322,159 | |
| 1957 | 681,656 | 723,512 | 1,405,168 | |
| 1958 | 642,978 | 672,204 | 1,315,182 | |
| 1959 | 681,330 | 710,200 | 1,391,531 | |
| 1960 | 740,273 | 780,134 | 1,520,406 | |
| 1961 | 765,813 | 805,230 | 1,571,044 | |
| 1962 | 794,366 | 838,806 | 1,633,173 | |
| 1963 | 862,974 | 901,451 | 1,764,425 | |
| 1964 | 952,854 | 990,752 | 1,943,606 | |
| 1965 | 1,010,208 | 1,058,060 | 2,068,268 | |
| 1966 | 1,075,325 | 1,127,023 | 2,202,348 | |
| 1967 | 1,093,203 | 1,143,349 | 2,236,552 | |
| 1968 | 1,163,869 | 1,211,963 | 2,375,832 | |
| 1969 | 1,269,228 | 1,315,048 | 2,584,276 | |
| 1970 | 1,379,446 | 1,431,665 | 2,811,111 | |
| 1971 | 1,467,084 | 1,516,816 | 2,983,900 | 15,047,582 |
| 1972 | 1,664,221 | 1,719,828 | 3,384,049 | 15,886,090 |
| 1973 | 2,181,961 | 2,238,391 | 4,420,352 | 16,884,344 |
| 1974 | 2,898,357 | 2,970,816 | 5,869,173 | 17,121,763 |
| 1975 | 2,765,082 | 2,875,433 | 5,640,514 | 17,300,454 |
| 1976 | 2,956,948 | 3,058,295 | 6,015,243 | 18,132,865 |
| 1977 | 3,161,313 | 3,281,824 | 6,443,137 | 18,850,509 |
| 1978 | 3,422,417 | 3,555,961 | 6,978,378 | 19,664,034 |
| 1979 | 4,011,761 | 4,096,398 | 8,108,159 | 20,466,059 |
| 1980 | 4,509,478 | 4,600,377 | 9,109,856 | 20,862,282 |
| 1981 | 4,073,651 | 4,187,146 | 8,260,796 | 21,257,504 |
| 1982 | 3,596,810 | 3,707,599 | 7,304,409 | 21,325,655 |
| 1983 | 3,391,972 | 3,472,821 | 6,864,793 | 21,878,560 |
| 1984 | 3,464,047 | 3,566,764 | 7,030,811 | 22,874,149 |
| 1985 | 3,358,347 | 3,463,188 | 6,821,535 | 23,751,997 |
| 1986 | 3,595,321 | 3,709,672 | 7,304,992 | 24,526,862 |
| 1987 | 4,118,491 | 4,226,528 | 8,345,018 | 25,389,202 |
| 1988 | 4,541,339 | 4,691,714 | 9,233,053 | 26,571,108 |
| 1989 | 4,725,164 | 4,882,263 | 9,607,426 | 27,569,354 |
| 1990 | 5,064,902 | 5,213,222 | 10,278,125 | 28,362,020 |
| 1991 | 4,987,367 | 5,154,795 | 10,142,162 | 28,806,602 |
| 1992 | 5,222,055 | 5,384,334 | 10,606,389 | 29,433,375 |
| 1993 | 5,127,167 | 5,254,600 | 10,381,767 | 29,941,242 |
| 1994 | 5,742,630 | 5,879,359 | 11,621,989 | 30,951,199 |
| 1995 | 6,717,584 | 6,873,686 | 13,591,271 | 31,841,142 |
| 1996 | 6,897,731 | 7,080,292 | 13,978,023 | 32,942,787 |
| 1997 | 7,020,891 | 7,206,741 | 14,227,632 | 34,188,303 |
| 1998 | 6,832,115 | 7,058,155 | 13,890,270 | 35,037,909 |
| 1999 | 6,992,980 | 7,248,851 | 14,241,831 | 36,125,898 |
| 2000 | 7,735,321 | 8,060,022 | 15,795,343 | 37,557,523 |
| 2001 | 7,244,024 | 7,588,031 | 14,832,055 | 38,142,310 |
| 2002 | 7,465,859 | 7,755,661 | 15,221,521 | 38,840,684 |
| 2003 | 8,541,073 | 8,854,115 | 17,395,188 | 39,904,986 |
| 2004 | 10,092,119 | 10,474,131 | 20,566,250 | 41,536,581 |
| 2005 | 11,114,096 | 11,508,416 | 22,622,512 | |
| 2006 | 12,438,987 | 12,762,464 | 25,201,451 | 49,766,113 |
| 2007 | 13,950,000 | 14,244,000 | 28,194,000 | 54,347,038 |
[ ]
Sources: see WTO