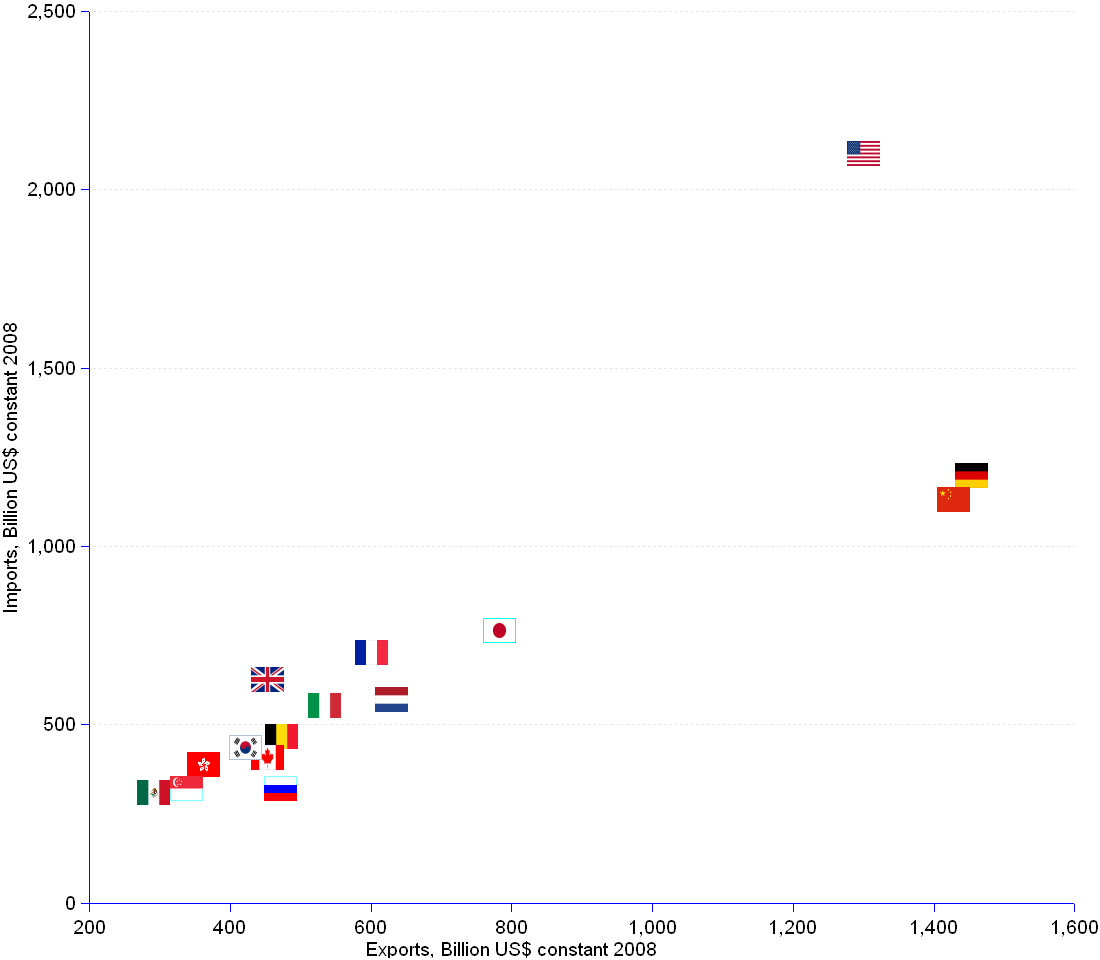

The traditional hierarchy of merchandise exporting nations is maintained in 2008. Germany is once more the world number 1 merchandise exporter, followed by China and the USA. However, the trade balance changed from 2007. China achieved the biggest merchandise trade balance, overtaking Germany by 16% (40 billion US$). The deterioration of the terms of trade is evidenced by the trade balance median change (-69% , from 19 to 6 billion US$ for the 15 nations). Customarily, the USA has by far the largest trade deficit (negative balance of 800 billion), although this country makes a 1.5% improvement, probably to be credited to the economy crisis and the crunch on consumption, rather than to better management of foreign trade. Amongst the worst in class, France offers a poor performance, deepening the trade deficit by 45% and ascending to the 3rd largest deficit, after the USA and the UK. The crisis has wounded several smart traders, such as Korea, Singapore and Hong Kong. But, for reasons still to explore, it did not impact negatively Russia that achieves the 3rd largest trade balance, with an increase of 36% over 2007.
World Merchandise Trade | |||||||
Country | 2007 | 2008 | Balance Change | ||||
Exports | Imports | Trade Balance | Exports | Imports | Trade Balance | (%) | |
| Billion US$ (constant 2008=100) | |||||||
| Germany | 1,349 | 1,077 | 272 | 1,453 | 1,197 | 257 | -5.6% |
| China, People's Republic of | 1,244 | 977 | 267 | 1,429 | 1,132 | 297 | 11.2% |
| United States | 1,188 | 2,000 | -812 | 1,301 | 2,100 | -800 | 1.5% |
| Japan | 728 | 634 | 94 | 784 | 763 | 21 | -77.6% |
| Netherlands | 562 | 503 | 59 | 629 | 570 | 60 | 0.2% |
| France | 563 | 632 | -69 | 602 | 701 | -100 | -44.6% |
| Italy | 510 | 522 | -12 | 535 | 552 | -17 | -39.3% |
| Belgium | 441 | 422 | 19 | 473 | 467 | 6 | -68.9% |
| Russian Federation | 362 | 251 | 111 | 472 | 321 | 151 | 35.7% |
| Canada | 429 | 387 | 42 | 454 | 406 | 48 | 15.2% |
| United Kingdom | 451 | 638 | -187 | 454 | 625 | -171 | 8.5% |
| Korea, Republic of | 380 | 365 | 15 | 422 | 435 | -13 | -188.5% |
| Hong Kong SAR | 352 | 376 | -24 | 363 | 389 | -26 | -9.3% |
| Singapore | 306 | 269 | 37 | 338 | 320 | 18 | -50.1% |
| Mexico | 278 | 288 | -10 | 291 | 309 | -17 | -66.7% |
| Median | 451 | 503 | 19 | 473 | 552 | 6 | -68.9% |
Sources: see IMF for merchandise trade data, and BEA for GDP deflator.