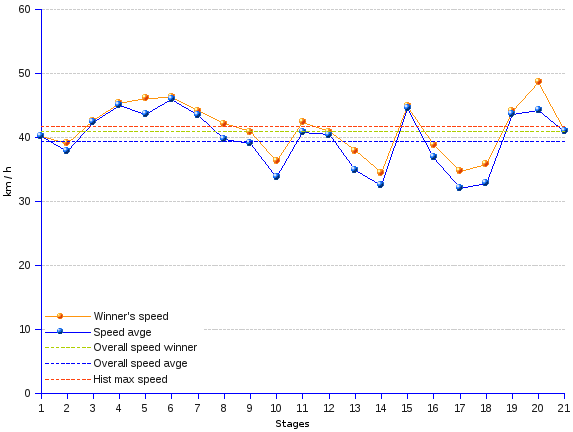

The time-trial 20th stage reached very high speed averages, with a 48.65 km/h average for the winner and 44.26 km/h for the whole bunch. Over the 20 stages, the fastest rider has achieved the average of 40.84 km/h, below the fastest ever overall average of 41.65 km/h in the 2005 Tour. The average of all riders reaches the mark of 39.26 km/h. The fastest leg has been the 20th stage, and the slowest the alpine 14th.
Average Speed | |||||
Stage | Distance | Stage Winner | Average | ||
Time | Speed | Time | Speed | ||
| 1 | 190.5 | 04:44:07 | 40.19 | 04:44:35 | 40.19 |
| 2 | 201 | 05:08:36 | 39.11 | 05:18:23 | 37.85 |
| 3 | 155 | 03:38:30 | 42.58 | 03:39:20 | 42.35 |
| 4 | 163.5 | 03:36:39 | 45.29 | 03:37:53 | 45.04 |
| 5 | 152.5 | 03:18:35 | 46.07 | 03:30:07 | 43.57 |
| 6 | 194 | 04:11:39 | 46.30 | 04:13:29 | 45.97 |
| 7 | 234.5 | 05:18:39 | 44.16 | 05:23:54 | 43.43 |
| 8 | 161 | 03:49:28 | 42.15 | 04:03:51 | 39.66 |
| 9 | 170 | 04:09:34 | 40.87 | 04:21:06 | 39.08 |
| 10 | 161.5 | 04:27:26 | 36.21 | 04:47:22 | 33.72 |
| 11 | 187.5 | 04:25:45 | 42.33 | 04:36:08 | 40.76 |
| 12 | 185.5 | 04:32:11 | 40.86 | 04:35:21 | 40.41 |
| 13 | 197.5 | 05:12:29 | 37.91 | 05:40:27 | 34.83 |
| 14 | 177 | 05:08:27 | 34.44 | 05:26:32 | 32.54 |
| 15 | 222 | 04:56:43 | 44.85 | 04:58:56 | 44.58 |
| 16 | 237.5 | 06:07:10 | 38.81 | 06:26:19 | 36.88 |
| 17 | 124.5 | 03:35:23 | 34.68 | 03:53:25 | 32.01 |
| 18 | 145.5 | 04:04:17 | 35.75 | 04:26:17 | 32.77 |
| 19 | 208.5 | 04:43:41 | 44.08 | 04:46:55 | 43.62 |
| 20 | 54 | 01:06:21 | 48.65 | 01:13:17 | 44.26 |
| 21 | 137.5 | 03:20:50 | 41.04 | 03:21:28 | 40.92 |
| Overall | 3,660.5 | 89:36:30 | 40.85 | 93:05:05 | 39.33 |
| Slowest stage (km/h) | 34.44 | 32.01 | |||
| Fastest stage (km/h) | 48.65 | 45.97 | |||
Sources: see Cycling