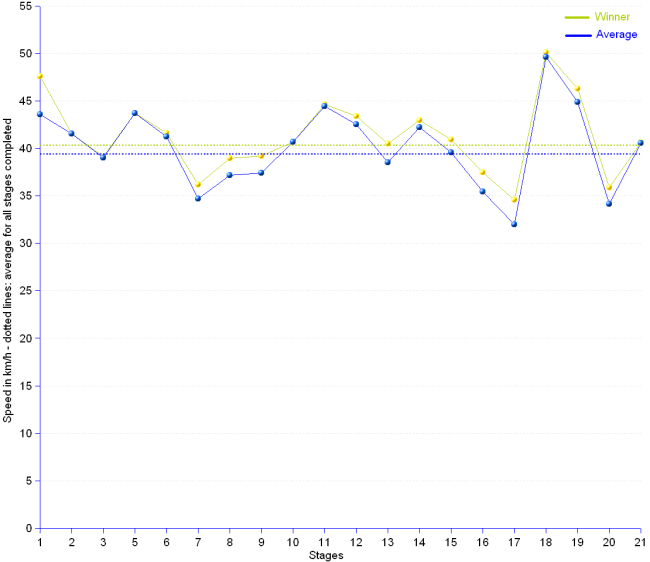

The 2009 Tour de France has been a fast although not a record-breaking race. The overall average speed of the winner over the 3,459.5 km is 40.32 km/h. The record remains with Armstrong's 41.65 km/h in 2005. The fastest stage was the time trial stage 18 with a high 50.1 km/h, and the slowest the high mountain stage 17 with 34.6 km/h. The average for all riders is 39.39 km/h.
Average Speed | |||||
Stage | Distance | First Ranked Rider | Average | ||
Time | Speed | Time | Speed | ||
| 1 | 15.5 | 00:19:32 | 47.61 | 00:21:20 | 43.59 |
| 2 | 187.0 | 04:30:02 | 41.55 | 04:30:07 | 41.54 |
| 3 | 196.5 | 05:01:24 | 39.12 | 05:02:21 | 38.99 |
| 5 | 196.5 | 04:29:35 | 43.73 | 04:29:53 | 43.69 |
| 6 | 181.5 | 04:21:33 | 41.64 | 04:24:06 | 41.23 |
| 7 | 224.0 | 06:11:31 | 36.18 | 06:27:21 | 34.7 |
| 8 | 176.5 | 04:31:50 | 38.96 | 04:44:53 | 37.17 |
| 9 | 160.5 | 04:05:31 | 39.22 | 04:17:30 | 37.4 |
| 10 | 194.5 | 04:46:43 | 40.7 | 04:46:58 | 40.67 |
| 11 | 192.0 | 04:17:55 | 44.67 | 04:18:04 | 44.43 |
| 12 | 211.5 | 04:52:24 | 43.4 | 04:58:12 | 42.56 |
| 13 | 200.0 | 04:56:26 | 40.5 | 05:11:23 | 38.54 |
| 14 | 199.0 | 04:37:46 | 42.99 | 04:42:32 | 42.26 |
| 15 | 207.5 | 05:03:58 | 40.96 | 05:14:22 | 39.6 |
| 16 | 159.0 | 04:14:20 | 37.5 | 04:29:05 | 35.45 |
| 17 | 169.5 | 04:53:54 | 34.6 | 05:17:35 | 32.02 |
| 18 | 40.5 | 00:48:30 | 50.1 | 00:48:58 | 49.63 |
| 19 | 178 | 03:50:35 | 46.32 | 03:58:02 | 44.87 |
| 20 | 167 | 04:39:21 | 35.87 | 04:53:36 | 34.13 |
| 21 | 164.0 | 04:02:18 | 40.61 | 04:02:26 | 40.59 |
| Overall | 3,459.5 | 85:48:35 | 40.32 | 87:50:03 | 39.39 |
[]
Sources: see Cycling