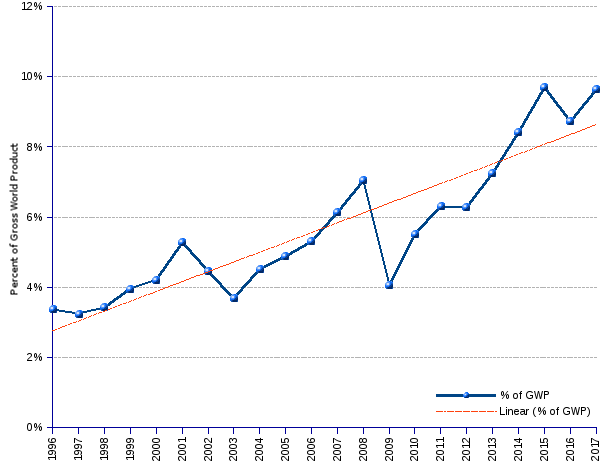
The relative weight of billionaire net worth in constant US$ follows an upward path from 3.4% in 1996 to 9.7% in 2017, corresponding to an annual average growth rate of 5.1% — almost twice as fast as the 2.6% annual average growth of real GWP. To put it plainly, billionaires have been deflecting to their balance sheets a growing share of the world's output — indeed their cut increases annually 2.5 percent points faster than the world product.
Billionaire Net Worth as Percent of Gross World Product | ||||||||
Year ¹ |
World Billionaires |
GWP (gross world product) ² |
Billionaire Net Worth as percent of GWP |
|||||
| Number | Net Worth (billion US$ current) |
Net Worth (billion US$ constant, 2009=100) ³ |
Average (billion US$ constant, 2009=100) |
Median (billion US$ constant, 2009=100) |
(trillion US$ current) | (trillion US$ constant 2009=100) |
||
| 1995 | 30.85 | 41.0 | ||||||
| 1996 | 423 | 1,049.5 | 1,393.3 | 3.3 | 2.5 | 31.71 | 41.3 | 3.37% |
| 1997 | 224 | 1,010.0 | 1,316.8 | 5.9 | 3.8 | 31.67 | 40.6 | 3.24% |
| 1998 | 209 | 1,069.1 | 1,370.4 | 6.6 | 4.2 | 31.49 | 39.9 | 3.43% |
| 1999 | 298 | 1,270.9 | 1,611.6 | 5.4 | 3.6 | 32.59 | 40.7 | 3.96% |
| 2000 | 322 | 1,386.1 | 1,731.2 | 5.4 | 3.6 | 33.65 | 41.1 | 4.21% |
| 2001 | 538 | 1,728.6 | 2,111.0 | 3.9 | 2.3 | 33.42 | 39.9 | 5.29% |
| 2002 | 472 | 1,515.5 | 1,809.5 | 3.8 | 2.1 | 34.56 | 40.6 | 4.45% |
| 2003 | 476 | 1,403.3 | 1,650.2 | 3.5 | 2.0 | 38.83 | 44.8 | 3.69% |
| 2004 | 587 | 1,917.2 | 2,210.4 | 3.8 | 2.2 | 43.71 | 49.0 | 4.51% |
| 2005 | 691 | 2,236.2 | 2,509.2 | 3.6 | 2.2 | 47.33 | 51.4 | 4.88% |
| 2006 | 793 | 2,645.5 | 2,875.9 | 3.6 | 2.2 | 51.26 | 54.1 | 5.32% |
| 2007 | 946 | 3,452.0 | 3,640.8 | 3.8 | 2.2 | 57.86 | 59.4 | 6.12% |
| 2008 | 1,125 | 4,381.0 | 4,500.9 | 4.0 | 2.3 | 63.42 | 63.9 | 7.04% |
| 2009 | 793 | 2,414.7 | 2,433.0 | 3.1 | 1.8 | 60.05 | 60.0 | 4.05% |
| 2010 | 1,011 | 3,567.8 | 3,567.8 | 2.0 | 3.5 | 65.64 | 64.9 | 5.50% |
| 2011 | 1,210 | 4,496.3 | 4,442.1 | 2.0 | 3.7 | 72.77 | 70.4 | 6.31% |
| 2012 | 1,226 | 4,574.5 | 4,427.9 | 3.6 | 2.0 | 74.09 | 70.4 | 6.29% |
| 2013 | 1,426 | 5,431.8 | 5,162.6 | 3.6 | 2.0 | 76.07 | 71.2 | 7.26% |
| 2014 | 1,645 | 6,446.5 | 6,029.7 | 3.7 | 2.1 | 78.04 | 71.7 | 8.41% |
| 2015 | 1,826 | 7,063.2 | 6,490.2 | 3.6 | 1.9 | 73.6 | 66.9 | 9.70% |
| 2016 | 1,810 | 6,482.6 | 5,893.4 | 3.3 | 1.9 | 75.21 | 67.5 | 8.73% |
| 2017 | 2,043 | 7,668.0 | 6,880.5 | 3.4 | 1.9 | 79.54 | 71.4 | 9.64% |
| Average annual change rate | 7.8% | 9.9% | 7.9% | 0.1% | -1.4% | 4.5% | 2.6% | 5.1% |
| ¹ Year of publication of Forbes list of billionaires. ² Forbes estimates are a snapshot of billionaire wealth as of the beginning of the year. We therefore relate billionaires' wealth to GWP of the preceding year. ³ US$ constant (2009=100) are estimated by applying the US$ GDP deflator for the preceding year. | ||||||||
Sources: Forbes List of World Billionaires, International Monetary Fund, World Economic Outlook Database, and CIA World Factbook.