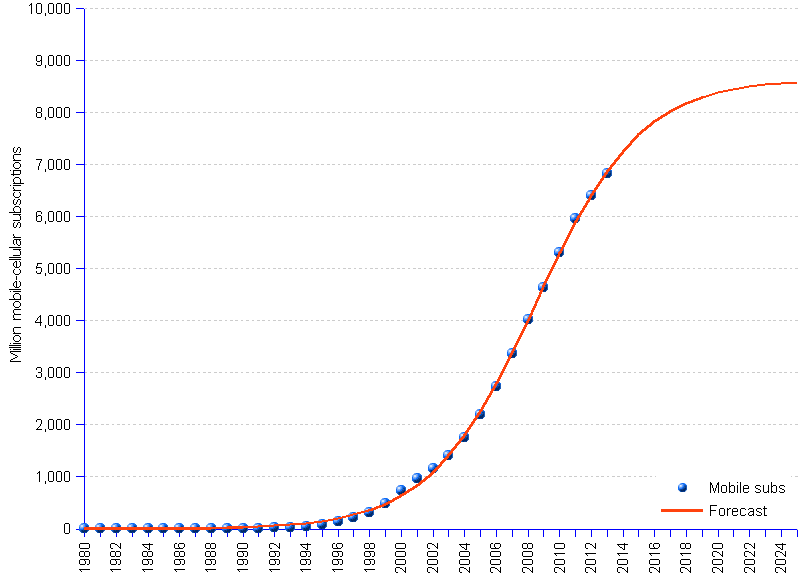
By the end of 2013 there were 6.8 billion mobile subscribers worldwide, corresponding to a global penetration of 96%, reports ITU (International Telecommunications Union). This averages 9.5 mobile phones for 10 people, or about 1 device per living person.
Our new forecast (compare with 2012, 2011, and 2008 forecasts) shows ITU's data of actual mobile subscriptions from 1980 through 2013, represented by blue dots, and areppim's forecast till 2025, represented by the S-shaped red line. The model anticipates a global market size of 8.6 billion subscribers by 2025, corresponding to 107% of the projected world population, and close to saturation that could happen at 8.7 billion subscribers by 2036.
Although our previous predictions have not been far off target, reality is unlikely to follow mathematics models that closely. First, the total world population in 2025 is expected to reach 8.01 billion people, of which 6.8 billion of age 10 to 84. It does not seem very reasonable to believe that each 10 people in this group will hold 13 subscriptions. Secondly, unforeseen technological innovations may totally upset the mobile phone paradigm, as the latter did to the fixed line telephony in the late 20th century. Thirdly, it is yet unclear what a mobile phone really is. In the 1980s a cell phone was a genuine phone, period; today, it is a device capable of performing a vast array of functions, including but not primarily that of a phone.
Be it as it may, the S-curve model raises some pertinent questions. If the period of exponential growth is already over as suggested, how could vendors stimulate growth ? Should stagnation rule in less than 10 years, what are suppliers and operators going to do to survive ? And more fascinating : what new communications technology is lurking in the dark, getting ready to take over ?
To summarize the current status of mobile cellular telephony, let us quote some highlights of ITU's "Measuring the Information Society" report, released in October 2013.
Mobile Cellular Phone Subscribers | ||
Year | Actual | Forecast ¹ |
| 1980 | 0.02 | 1.7 |
| 1981 | 0.06 | 2.3 |
| 1982 | 0.10 | 3.1 |
| 1983 | 0.15 | 4.2 |
| 1984 | 0.32 | 5.7 |
| 1985 | 0.75 | 7.7 |
| 1986 | 1.45 | 10.4 |
| 1987 | 2.55 | 14.0 |
| 1988 | 4.33 | 18.9 |
| 1989 | 7.35 | 25.4 |
| 1990 | 11.21 | 34.3 |
| 1991 | 16.00 | 46.2 |
| 1992 | 23.00 | 62.1 |
| 1993 | 34.00 | 83.6 |
| 1994 | 56.00 | 112.4 |
| 1995 | 91.00 | 150.9 |
| 1996 | 145 | 202.2 |
| 1997 | 215 | 270.6 |
| 1998 | 318 | 361.0 |
| 1999 | 490 | 479.8 |
| 2000 | 738 | 634.9 |
| 2001 | 961 | 834.9 |
| 2002 | 1,157 | 1,089.3 |
| 2003 | 1,417 | 1,407.4 |
| 2004 | 1,763 | 1,796.3 |
| 2005 | 2,205 | 2,259.1 |
| 2006 | 2,745 | 2,792.7 |
| 2007 | 3,368 | 3,385.5 |
| 2008 | 4,030 | 4,018.0 |
| 2009 | 4,640 | 4,664.0 |
| 2010 | 5,320 | 5,295.3 |
| 2011 | 5,962 | 5,886.0 |
| 2012 ² | 6,411 | 6,416.7 |
| 2013 ² | 6,835 | 6,876.4 |
| 2014 | 7,262.3 | |
| 2015 | 7,577.5 | |
| 2016 | 7,829.5 | |
| 2017 | 8,027.4 | |
| 2018 | 8,180.8 | |
| 2019 | 8,298.3 | |
| 2020 | 8,387.6 | |
| 2021 | 8,455.1 | |
| 2022 | 8,505.9 | |
| 2023 | 8,543.9 | |
| 2024 | 8,572.4 | |
| 2025 | 8,593.6 | |
| ¹ Logistic growth function | ||
| ² ITU's estimates. | ||
Source: ITU International Telecommunications Union