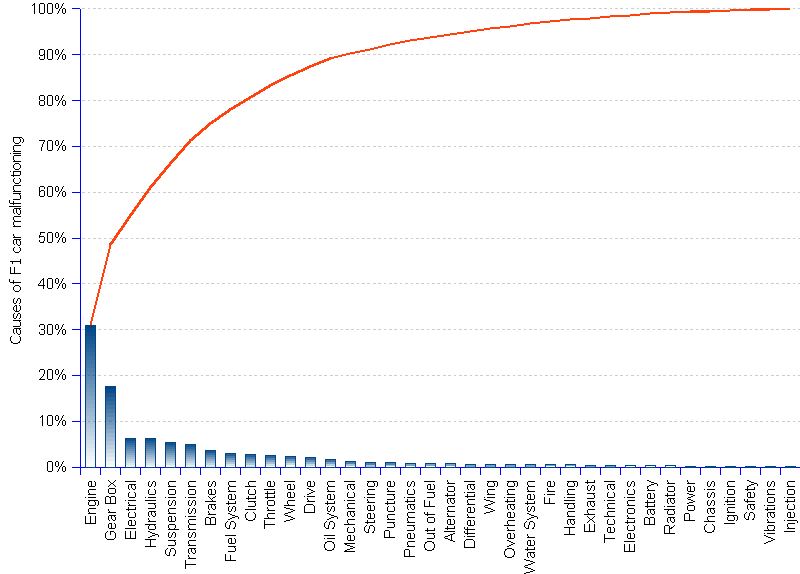

Official reports of Grand Prix races (1990-2013) strongly suggest that engines and gear boxes are the principal cause of car failures, accounting together for roughly 50% of all F1 breakdowns. Although available data do not exactly match the classical Pareto distribution (according to which 80% of the failures are caused by 20% of the component elements — in the chart, the Pareto distribution is represented by the red line), engine faults are patently to blame for incapacitating the vehicles 31% of the time, fully justifying that a round 50% of the budget of Formula 1 teams is devoted to engine development. In the case of wealthy teams, that means approximately 200 million US$ per season. It becomes obvious that developing a robust F1 car engine, capable of withstanding the harsh Grand Prix requirements, is neither a trivial nor a low-cost exercise.
Formula 1 | |||
Reported failure category |
Reported occurrences |
||
Number |
Percent of total |
Percent cumulative |
|
| Alternator | 14 | 0.69% | 0.69% |
| Battery | 5 | 0.25% | 0.94% |
| Brakes | 73 | 3.62% | 4.56% |
| Chassis | 3 | 0.15% | 4.71% |
| Clutch | 55 | 2.73% | 7.43% |
| Differential | 12 | 0.59% | 8.03% |
| Drive | 42 | 2.08% | 10.11% |
| Electrical | 127 | 6.29% | 16.40% |
| Electronics | 6 | 0.30% | 16.70% |
| Engine | 625 | 30.97% | 47.67% |
| Exhaust | 7 | 0.35% | 48.02% |
| Fire | 9 | 0.45% | 48.46% |
| Fuel System | 61 | 3.02% | 51.49% |
| Gear Box | 356 | 17.64% | 69.13% |
| Handling | 9 | 0.45% | 69.57% |
| Hydraulics | 124 | 6.14% | 75.72% |
| Ignition | 3 | 0.15% | 75.87% |
| Injection | 1 | 0.05% | 75.92% |
| Mechanical | 23 | 1.14% | 77.06% |
| Oil System | 33 | 1.64% | 78.69% |
| Out of Fuel | 16 | 0.79% | 79.48% |
| Overheating | 11 | 0.55% | 80.03% |
| Pneumatics | 17 | 0.84% | 80.87% |
| Power | 4 | 0.20% | 81.07% |
| Puncture | 19 | 0.94% | 82.01% |
| Radiator | 5 | 0.25% | 82.26% |
| Safety | 3 | 0.15% | 82.41% |
| Steering | 20 | 0.99% | 83.40% |
| Suspension | 106 | 5.25% | 88.65% |
| Technical | 7 | 0.35% | 89.00% |
| Throttle | 51 | 2.53% | 91.53% |
| Transmission | 101 | 5.00% | 96.53% |
| Vibrations | 3 | 0.15% | 96.68% |
| Water System | 11 | 0.55% | 97.22% |
| Wheel | 44 | 2.18% | 99.41% |
| Wing | 12 | 0.59% | 100.00% |
| Total | 2018 | 100.00% | |
Sources: see Formula 1