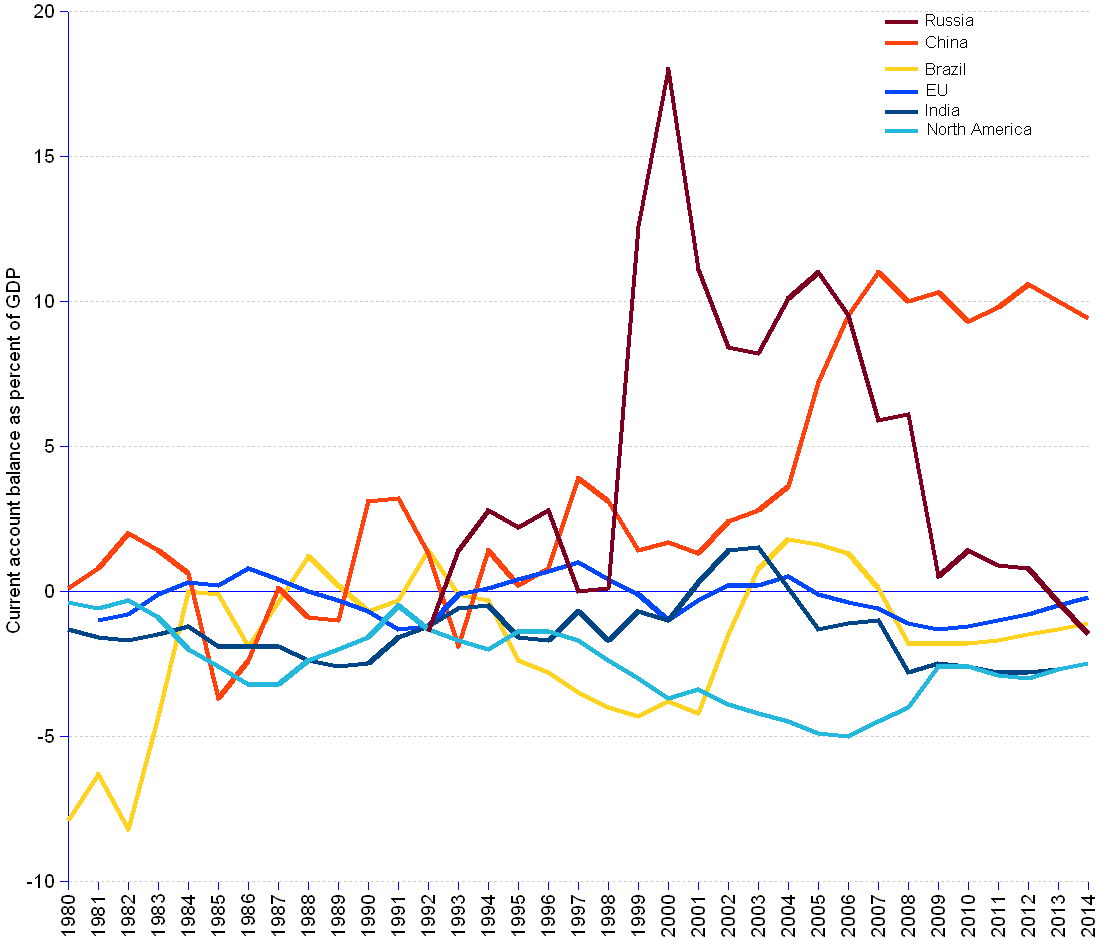

IMF forecasts of the Current Account balance in percent of GDP suggest hard times to come for all the big economic powers with the exception of China. European Union, North America, Brazil and India will experience lukewarm balances of less than 0%. Russia may live through a dramatic shrinking of its balance that could become negative by 2013. China, thanks largely to its manufacturing capability, will maintain enviable percent surpluses in the 2 digit bracket.
Current Account Balance | |||||||
Year | Brazil | China, People's Republic of | Euro area | European Union | India | North America | Russian Federation |
| 1980 | -7.9 | 0.1 | -1.3 | -0.4 | |||
| 1981 | -6.3 | 0.8 | -1 | -1.6 | -0.6 | ||
| 1982 | -8.2 | 2 | -0.8 | -1.7 | -0.3 | ||
| 1983 | -4.3 | 1.4 | -0.1 | -1.5 | -0.9 | ||
| 1984 | 0 | 0.6 | 0.3 | -1.2 | -2 | ||
| 1985 | -0.1 | -3.7 | 0.2 | -1.9 | -2.6 | ||
| 1986 | -1.9 | -2.4 | 0.8 | -1.9 | -3.2 | ||
| 1987 | -0.4 | 0.1 | 0.4 | -1.9 | -3.2 | ||
| 1988 | 1.2 | -0.9 | 0 | -2.4 | -2.4 | ||
| 1989 | 0.2 | -1 | -0.3 | -2.6 | -2 | ||
| 1990 | -0.7 | 3.1 | -0.7 | -2.5 | -1.6 | ||
| 1991 | -0.3 | 3.2 | -1.3 | -1.6 | -0.5 | ||
| 1992 | 1.4 | 1.3 | -1.2 | -1.2 | -1.3 | -1.4 | |
| 1993 | -0.1 | -1.9 | -0.1 | -0.6 | -1.7 | 1.4 | |
| 1994 | -0.3 | 1.4 | 0.1 | -0.5 | -2 | 2.8 | |
| 1995 | -2.4 | 0.2 | 0.4 | -1.6 | -1.4 | 2.2 | |
| 1996 | -2.8 | 0.8 | 0.7 | -1.7 | -1.4 | 2.8 | |
| 1997 | -3.5 | 3.9 | 1.4 | 1 | -0.7 | -1.7 | 0 |
| 1998 | -4 | 3.1 | 0.7 | 0.4 | -1.7 | -2.4 | 0.1 |
| 1999 | -4.3 | 1.4 | 0.4 | -0.1 | -0.7 | -3 | 12.6 |
| 2000 | -3.8 | 1.7 | -0.6 | -1 | -1 | -3.7 | 18 |
| 2001 | -4.2 | 1.3 | 0.1 | -0.3 | 0.3 | -3.4 | 11.1 |
| 2002 | -1.5 | 2.4 | 0.7 | 0.2 | 1.4 | -3.9 | 8.4 |
| 2003 | 0.8 | 2.8 | 0.5 | 0.2 | 1.5 | -4.2 | 8.2 |
| 2004 | 1.8 | 3.6 | 1.2 | 0.5 | 0.1 | -4.5 | 10.1 |
| 2005 | 1.6 | 7.2 | 0.4 | -0.1 | -1.3 | -4.9 | 11 |
| 2006 | 1.3 | 9.5 | 0.3 | -0.4 | -1.1 | -5 | 9.5 |
| 2007 | 0.1 | 11 | 0.2 | -0.6 | -1 | -4.5 | 5.9 |
| 2008 | -1.8 | 10 | -0.7 | -1.1 | -2.8 | -4 | 6.1 |
| 2009 | -1.8 | 10.3 | -1.1 | -1.3 | -2.5 | -2.6 | 0.5 |
| 2010 | -1.8 | 9.3 | -1.2 | -1.2 | -2.6 | -2.6 | 1.4 |
| 2011 | -1.7 | 9.8 | -1 | -1 | -2.8 | -2.9 | 0.9 |
| 2012 | -1.5 | 10.6 | -0.7 | -0.8 | -2.8 | -3 | 0.8 |
| 2013 | -1.3 | 10 | -0.4 | -0.5 | -2.7 | -2.7 | -0.4 |
| 2014 | -1.1 | 9.4 | -0.1 | -0.2 | -2.5 | -2.5 | -1.5 |
Sources: see IMF.