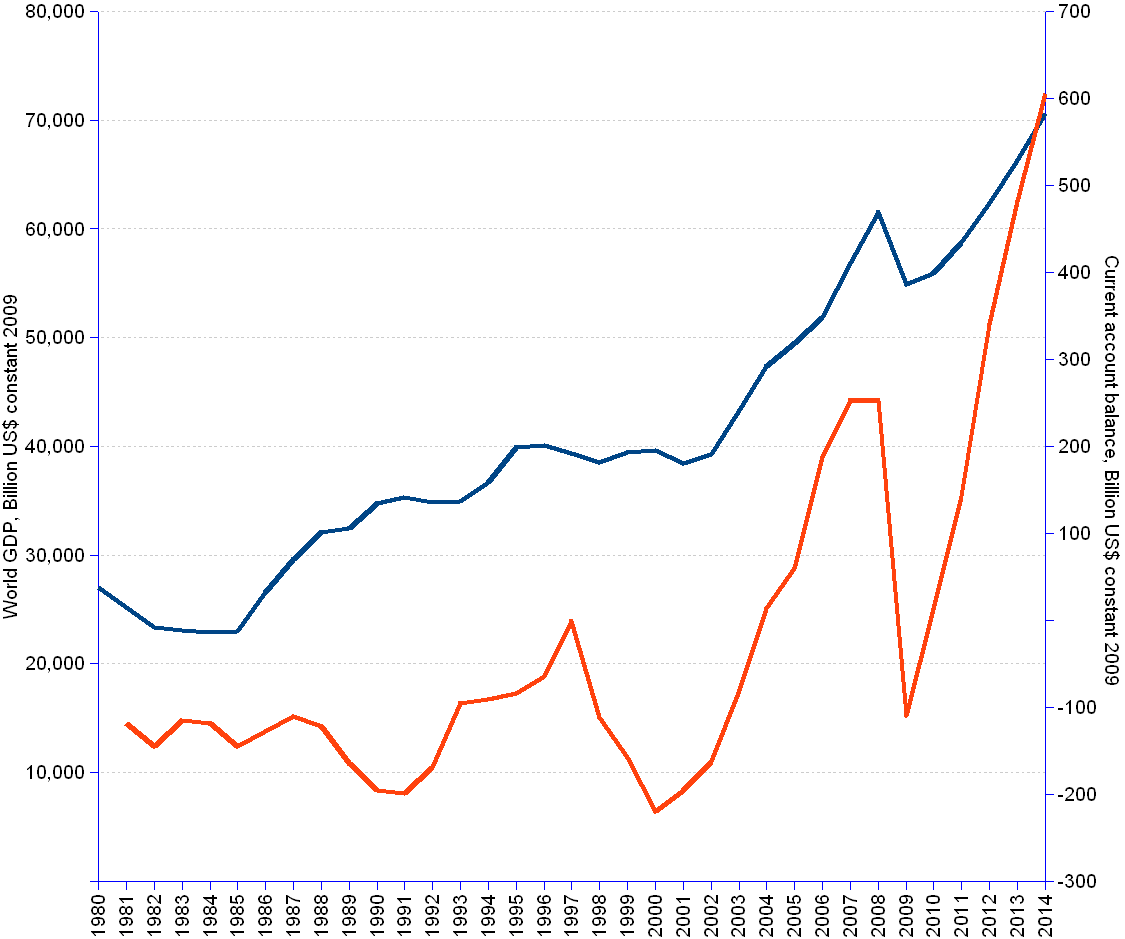

Both world GDP (scale at left Y-axis) and Current Account balance (scale at right Y-axis) made a sudden and brutal dive in 2008, as a result of the crisis triggered by the US subprime financial disaster. The impressive fall of the Current Account balance signals the brutal landing of imports and exports of goods and services. The 2000-2002 crisis that followed the burst of the Internet bubble does not compare with the 2008 plunge. Fortunately, IMF forecasts for the period 2009-2014 anticipate a strong recovery after 2010. Hopefully this turnaround will result from genuine underlying economic factors, rather than from the linear regression techniques so much in favour with econometricians.
World GDP / Current Account Balance | |||||
Year | World GDP | Current Account Balance | GDP Deflator | World GDP | Current Account Balance |
| Billion US$ (current) | Billion US$ (constant 2009-I = 100) | ||||
| 1980 | 11,770 | 54.04 | 27,027 | ||
| 1981 | 11,974 | -56.65 | 59.12 | 25,135 | -118.91 |
| 1982 | 11,812 | -73.28 | 62.73 | 23,369 | -144.98 |
| 1983 | 12,105 | -60.72 | 65.21 | 23,037 | -115.56 |
| 1984 | 12,478 | -64.69 | 67.66 | 22,888 | -118.66 |
| 1985 | 12,888 | -81.7 | 69.71 | 22,942 | -145.44 |
| 1986 | 15,228 | -73.58 | 71.25 | 26,523 | -128.16 |
| 1987 | 17,457 | -64.98 | 73.2 | 29,597 | -110.17 |
| 1988 | 19,561 | -74.16 | 75.69 | 32,070 | -121.58 |
| 1989 | 20,550 | -103.99 | 78.56 | 32,463 | -164.28 |
| 1990 | 22,823 | -128.3 | 81.59 | 34,713 | -195.14 |
| 1991 | 24,026 | -135.27 | 84.44 | 35,309 | -198.79 |
| 1992 | 24,243 | -117.62 | 86.39 | 34,826 | -168.97 |
| 1993 | 24,852 | -68.37 | 88.38 | 34,895 | -96 |
| 1994 | 26,687 | -66.3 | 90.26 | 36,692 | -91.16 |
| 1995 | 29,621 | -62.34 | 92.11 | 39,909 | -83.99 |
| 1996 | 30,336 | -49.2 | 93.85 | 40,112 | -65.06 |
| 1997 | 30,221 | -0.98 | 95.41 | 39,305 | -1.27 |
| 1998 | 29,954 | -86.82 | 96.47 | 38,531 | -111.68 |
| 1999 | 31,085 | -124.16 | 97.87 | 39,416 | -157.44 |
| 2000 | 31,942 | -177.4 | 100 | 39,639 | -220.15 |
| 2001 | 31,707 | -161.07 | 102.4 | 38,426 | -195.2 |
| 2002 | 32,988 | -135.8 | 104.19 | 39,291 | -161.75 |
| 2003 | 37,087 | -68.83 | 106.4 | 43,254 | -80.28 |
| 2004 | 41,728 | 12.28 | 109.46 | 47,307 | 13.92 |
| 2005 | 45,090 | 53.75 | 113.03 | 49,503 | 59.01 |
| 2006 | 48,761 | 176.11 | 116.68 | 51,863 | 187.31 |
| 2007 | 54,841 | 243.8 | 119.82 | 56,800 | 252.51 |
| 2008 | 60,690 | 249.48 | 122.42 | 61,520 | 252.89 |
| 2009 | 54,864 | -108.88 | 124.1 ¹ | 54,864 | -108.88 |
| 2010 | 55,921 | 12.55 | 55,921 | 12.55 | |
| 2011 | 58,726 | 142.63 | 58,726 | 142.63 | |
| 2012 | 62,321 | 339.67 | 62,321 | 339.67 | |
| 2013 | 66,290 | 481.08 | 66,290 | 481.08 | |
| 2014 | 70,601 | 605.64 | 70,601 | 605.64 | |
| ¹ deflator for Q1 2009 | |||||
Sources: see IMF for GDP and Current Account data, and BEA for GDP deflator.