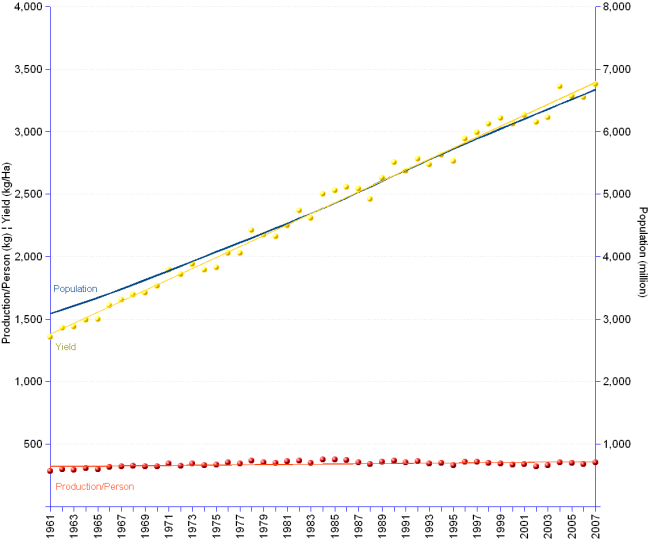
From 1961 to 2007, cereal production yields improved dramatically thanks to science-based agricultural methods that include high-yield variety selection, synthetic fertilizers and pesticides, mechanisation and irrigation projects. In fact, cereal yields in 2007 were 2.5 times higher than in 1961, having grown at an annual average rate of 2.0%, faster than population (average annual growth rate of 1.7%). And yet, these productivity gains have not been strong enough to enable production per capita to effectively take off, the latter having increased at a snail rate of 0.5% per year, below what is needed to provide abundant food to everyone. If the law of diminishing returns starts playing with yields, then world cereals production per person may experience a worrisome setback.
[Primary Y-axis: production per person in kilograms, and yield in kilogram/hectare. Secondary Y-axis: population in millions. Dots represent actual data, for which the corresponding regression lines are provided in the same colour.]
World | |||
Year | Population | Yield | Production/person |
| 1961 | 3,090 | 1,353 | 284 |
| 1962 | 3,150 | 1,428 | 296 |
| 1963 | 3,212 | 1,440 | 296 |
| 1964 | 3,277 | 1,494 | 306 |
| 1965 | 3,343 | 1,497 | 299 |
| 1966 | 3,411 | 1,611 | 316 |
| 1967 | 3,481 | 1,654 | 323 |
| 1968 | 3,552 | 1,697 | 327 |
| 1969 | 3,625 | 1,709 | 323 |
| 1970 | 3,699 | 1,766 | 322 |
| 1971 | 3,773 | 1,892 | 344 |
| 1972 | 3,849 | 1,858 | 327 |
| 1973 | 3,925 | 1,941 | 346 |
| 1974 | 4,001 | 1,893 | 332 |
| 1975 | 4,076 | 1,913 | 334 |
| 1976 | 4,151 | 2,026 | 353 |
| 1977 | 4,225 | 2,025 | 345 |
| 1978 | 4,300 | 2,213 | 368 |
| 1979 | 4,375 | 2,176 | 351 |
| 1980 | 4,451 | 2,161 | 348 |
| 1981 | 4,529 | 2,247 | 360 |
| 1982 | 4,608 | 2,369 | 367 |
| 1983 | 4,689 | 2,309 | 347 |
| 1984 | 4,771 | 2,499 | 375 |
| 1985 | 4,855 | 2,529 | 375 |
| 1986 | 4,941 | 2,556 | 371 |
| 1987 | 5,029 | 2,540 | 352 |
| 1988 | 5,118 | 2,460 | 338 |
| 1989 | 5,207 | 2,629 | 359 |
| 1990 | 5,295 | 2,755 | 369 |
| 1991 | 5,382 | 2,684 | 351 |
| 1992 | 5,467 | 2,783 | 361 |
| 1993 | 5,552 | 2,737 | 343 |
| 1994 | 5,636 | 2,814 | 347 |
| 1995 | 5,719 | 2,765 | 332 |
| 1996 | 5,802 | 2,943 | 357 |
| 1997 | 5,883 | 2,994 | 356 |
| 1998 | 5,964 | 3,063 | 349 |
| 1999 | 6,045 | 3,110 | 345 |
| 2000 | 6,124 | 3,062 | 336 |
| 2001 | 6,203 | 3,132 | 340 |
| 2002 | 6,281 | 3,074 | 323 |
| 2003 | 6,359 | 3,111 | 328 |
| 2004 | 6,437 | 3,362 | 354 |
| 2005 | 6,515 | 3,283 | 348 |
| 2006 | 6,593 | 3,271 | 340 |
| 2007 | 6,671 | 3,380 | 352 |
| Average change/year | 1.7% | 2.0% | 0.5% |
[]
Sources: see FAOSTAT for cereals production data, and United Nations Statistics Division for population data.