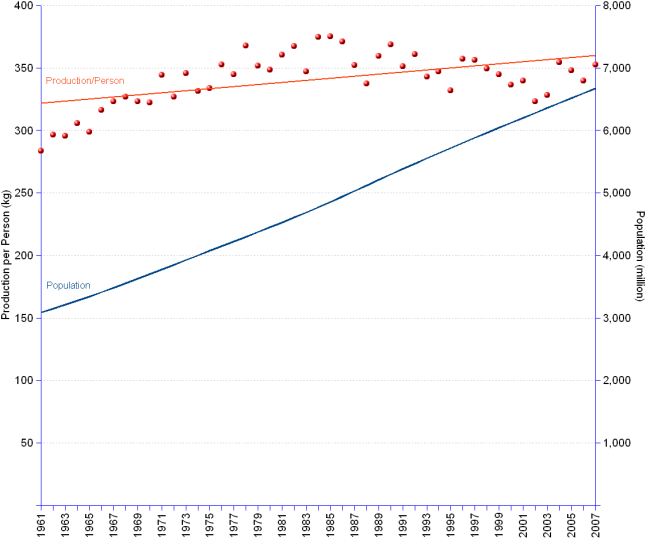
Worldwide cereals production grew at a faster rate than population, enabling the per capita ratio to improve by 24% from 1961 (284 kg/person) to 2007 (352 kg/person). That is the good news. The less good news however is the decaying trend that cereals production per capita took in the recent decades. After reaching the peak of 375 kg/person in 1981, it started to decline slowly but steadily, having lost 6.2 percent points by 2007 (annual change average rate of -0.28%). This is a bad omen for the plans to eradicate hunger.
[Primary Y-axis: per capita production in kilogram/person. Secondary Y-axis: population in millions. Dots represent actual data, for which the corresponding regression line is provided in the same colour.]
World | |||
Year | Population | Production | Production/person |
| 1961 | 3,090 | 877 | 284 |
| 1962 | 3,150 | 933 | 296 |
| 1963 | 3,212 | 949 | 296 |
| 1964 | 3,277 | 1,001 | 306 |
| 1965 | 3,343 | 999 | 299 |
| 1966 | 3,411 | 1,079 | 316 |
| 1967 | 3,481 | 1,124 | 323 |
| 1968 | 3,552 | 1,161 | 327 |
| 1969 | 3,625 | 1,171 | 323 |
| 1970 | 3,699 | 1,193 | 322 |
| 1971 | 3,773 | 1,300 | 344 |
| 1972 | 3,849 | 1,259 | 327 |
| 1973 | 3,925 | 1,357 | 346 |
| 1974 | 4,001 | 1,327 | 332 |
| 1975 | 4,076 | 1,360 | 334 |
| 1976 | 4,151 | 1,464 | 353 |
| 1977 | 4,225 | 1,456 | 345 |
| 1978 | 4,300 | 1,582 | 368 |
| 1979 | 4,375 | 1,538 | 351 |
| 1980 | 4,451 | 1,550 | 348 |
| 1981 | 4,529 | 1,633 | 360 |
| 1982 | 4,608 | 1,693 | 367 |
| 1983 | 4,689 | 1,627 | 347 |
| 1984 | 4,771 | 1,787 | 375 |
| 1985 | 4,855 | 1,821 | 375 |
| 1986 | 4,941 | 1,834 | 371 |
| 1987 | 5,029 | 1,772 | 352 |
| 1988 | 5,118 | 1,727 | 338 |
| 1989 | 5,207 | 1,871 | 359 |
| 1990 | 5,295 | 1,952 | 369 |
| 1991 | 5,382 | 1,890 | 351 |
| 1992 | 5,467 | 1,974 | 361 |
| 1993 | 5,552 | 1,903 | 343 |
| 1994 | 5,636 | 1,956 | 347 |
| 1995 | 5,719 | 1,898 | 332 |
| 1996 | 5,802 | 2,072 | 357 |
| 1997 | 5,883 | 2,095 | 356 |
| 1998 | 5,964 | 2,084 | 349 |
| 1999 | 6,045 | 2,085 | 345 |
| 2000 | 6,124 | 2,060 | 336 |
| 2001 | 6,203 | 2,108 | 340 |
| 2002 | 6,281 | 2,031 | 323 |
| 2003 | 6,359 | 2,089 | 328 |
| 2004 | 6,437 | 2,281 | 354 |
| 2005 | 6,515 | 2,267 | 348 |
| 2006 | 6,593 | 2,239 | 340 |
| 2007 | 6,671 | 2,351 | 352 |
| Average change/year | 1.7% | 2.2% | 0.5% |
[]
Sources: see FAOSTAT for cereals production data, and United Nations Statistics Division for population data.