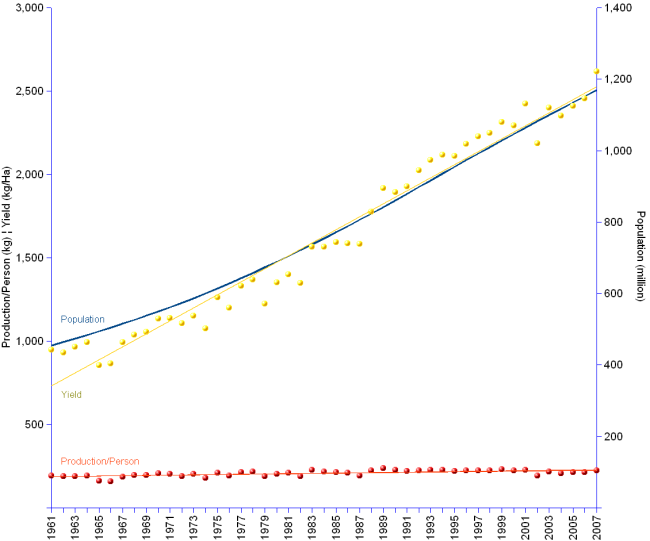
India's population almost trebled from 455 million in 1961 to 1.17 billion in 2007, at an annual average growth rate of 2.1%. In spite of a comparable increase of total cereals production, production per capita could not change significantly without major productivity improvements. Such improvements did not happen, notwithstanding sizeable yield increases from 947 kilogram/hectare in 1961 to 2,619 in 2007, at an annual average rate of 2.2%, above the world equivalent rate of 2% but well below China's rate of 3.3%. Inevitably India's production per person could only grow modestly. It went from 192 kg per person in 1961 to 223 kg in 2007, at an annual average rate of 0.3%. This can hardly satisfy the country's cereals requirements current and for the years to come.
[Primary Y-axis: production per person in kilograms, and yield in kilogram/hectare. Secondary Y-axis: population in millions. Dots represent actual data, for which the corresponding regression lines are provided in the same colour.]
India | |||
Year | Population | Yield | Production/person |
| 1961 | 455 | 947 | 192 |
| 1962 | 464 | 930 | 188 |
| 1963 | 474 | 966 | 191 |
| 1964 | 484 | 994 | 194 |
| 1965 | 494 | 854 | 161 |
| 1966 | 504 | 864 | 159 |
| 1967 | 515 | 994 | 185 |
| 1968 | 526 | 1,037 | 195 |
| 1969 | 538 | 1,054 | 198 |
| 1970 | 549 | 1,135 | 207 |
| 1971 | 561 | 1,136 | 202 |
| 1972 | 574 | 1,108 | 189 |
| 1973 | 587 | 1,153 | 204 |
| 1974 | 600 | 1,074 | 178 |
| 1975 | 614 | 1,261 | 208 |
| 1976 | 628 | 1,199 | 194 |
| 1977 | 643 | 1,331 | 215 |
| 1978 | 658 | 1,370 | 217 |
| 1979 | 673 | 1,222 | 188 |
| 1980 | 689 | 1,350 | 204 |
| 1981 | 705 | 1,399 | 209 |
| 1982 | 721 | 1,346 | 189 |
| 1983 | 737 | 1,564 | 226 |
| 1984 | 754 | 1,564 | 218 |
| 1985 | 771 | 1,592 | 215 |
| 1986 | 788 | 1,585 | 209 |
| 1987 | 806 | 1,584 | 194 |
| 1988 | 824 | 1,776 | 223 |
| 1989 | 842 | 1,916 | 237 |
| 1990 | 860 | 1,891 | 225 |
| 1991 | 879 | 1,926 | 220 |
| 1992 | 898 | 2,025 | 224 |
| 1993 | 917 | 2,085 | 228 |
| 1994 | 935 | 2,116 | 227 |
| 1995 | 954 | 2,112 | 220 |
| 1996 | 973 | 2,181 | 225 |
| 1997 | 992 | 2,229 | 225 |
| 1998 | 1,010 | 2,248 | 225 |
| 1999 | 1,028 | 2,314 | 230 |
| 2000 | 1,046 | 2,294 | 224 |
| 2001 | 1,064 | 2,423 | 228 |
| 2002 | 1,082 | 2,187 | 191 |
| 2003 | 1,099 | 2,399 | 215 |
| 2004 | 1,117 | 2,350 | 206 |
| 2005 | 1,134 | 2,412 | 212 |
| 2006 | 1,152 | 2,456 | 212 |
| 2007 | 1,169 | 2,619 | 223 |
| Average change/year | 2.1% | 2.2% | 0.3% |
[]
Sources: see FAOSTAT for cereals production data, and United Nations Statistics Division for population data.