areppim: information, pure and simple

In the mid 19th century, Switzerland was one of the front runners that successfully engaged in the industrial revolution initiated by the Great Britain. The industrial economy became a powerful drive to master the techniques, technologies and subsequently the basic science on which its accomplishment depended.
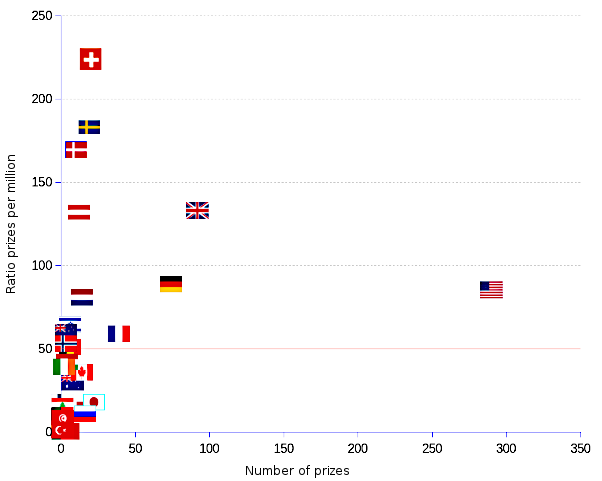
That explains why today's Switzerland is not only direct democracy, chocolates, instant coffee and clocks — it's also high achievement in science. Indeed it rises to the very top in terms of number of Nobel prizes for "hard science" — chemistry, physics and physiology or medicine — per capita.
Swiss nationals collected 20 awards, thus positioning the nation in the sixth rank in absolute terms. With an index of 226.5, or sevenfold the median of 31 (the average value of 51 is shown by the red line in the chart), Switzerland outperforms by a wide margin in per capita terms such absolute heavyweights as US, UK, Germany or France. In fact, small nations perform astoundingly well, compared with the giants: Switzerland, Sweden, Denmark and Austria are conspicuously placed in the top tier of the ranking.
The very nature of the three disciplines under consideration, requiring an exacting specification of both output and processes, makes easier the application of more objective, at least more easily measurable criteria for evaluating performance, than those that can be used in other Nobel prize domains such as peace, literature or even the "dismal" (Carlyle's words) science of economics. Furthermore, the scientists' core tradition of submitting research results to peers to be scrutinized, debated and assessed in open forums, enhances the probability of a fairer grading of scientific achievement. In spite of the fact that today's science is a costly endeavor, nourished by syndicates of public and private financiers who can, and often do dictate what research should focus on, what is and what is not good science, and what should or should not be brought to the public's attention, performance in these three categories still remains the most reliable available indicator to appreciate the real scientific standings of the various nations.
![]() Take a look at the complete Nobel prize lists
Take a look at the complete Nobel prize lists
| Nobel Prizes Chemistry + Physics + Physiology or Medicine | |||
|---|---|---|---|
| Nation ¹ | Number of Nobel awards | Population in 2023 (thousands) | Nobel Index (per million x 100) |
| Argentina | 3 | 46.4 | 6.5 |
| Australia | 8 | 26.3 | 30.4 |
| Austria | 12 | 9.1 | 132.1 |
| Belgium | 6 | 11.7 | 51.3 |
| Canada | 14 | 38.7 | 36.2 |
| China | 5 | 1,452.1 | 0.3 |
| Czechia | 1 | 10.7 | 9.3 |
| Denmark | 10 | 5.9 | 170.7 |
| Egypt | 1 | 108.0 | 0.9 |
| Finland | 1 | 5.6 | 18.0 |
| France | 39 | 65.7 | 59.3 |
| Germany | 74 | 83.8 | 88.3 |
| Hungary | 3 | 9.6 | 31.3 |
| India | 1 | 1,419.7 | 0.1 |
| Ireland | 2 | 5.1 | 39.6 |
| Israel | 6 | 9.1 | 66.3 |
| Italy | 8 | 60.1 | 13.3 |
| Japan | 22 | 125.1 | 17.6 |
| Lebanon | 1 | 6.6 | 15.2 |
| Netherlands | 14 | 17.2 | 81.2 |
| New Zealand | 3 | 4.9 | 60.8 |
| Norway | 3 | 5.6 | 54.0 |
| Pakistan | 1 | 233.8 | 0.4 |
| Portugal | 1 | 10.1 | 9.9 |
| Russia | 15 | 145.6 | 10.3 |
| South Africa | 1 | 61.5 | 1.6 |
| Spain | 1 | 46.7 | 2.1 |
| Sweden | 19 | 10.3 | 184.9 |
| Switzerland | 20 | 8.8 | 226.5 |
| Turkey | 1 | 86.0 | 1.2 |
| United Kingdom | 90 | 68.8 | 130.9 |
| United States | 285 | 336.7 | 84.7 |
| Total | 671 | ||
| Median | 30.8 | ||
| Average | 51.1 | ||
| ¹ Double nationals counted twice, once for each nationality. National of former Czechoslovakia appears under Czechia. Nationals of former Soviet Union appear under Russia. | |||
Sources: Nobelprize and UN Population Division