areppim: information, pure and simple
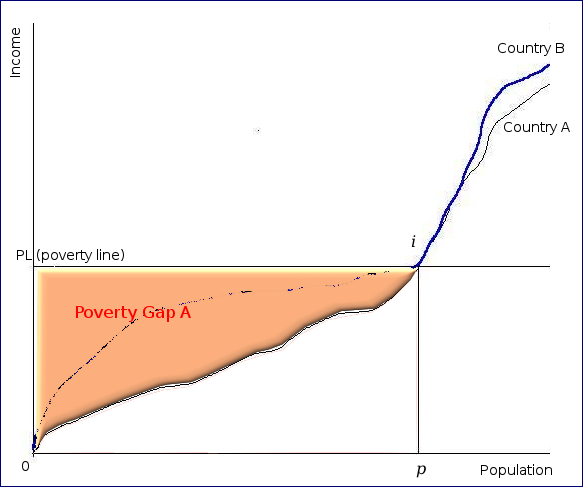
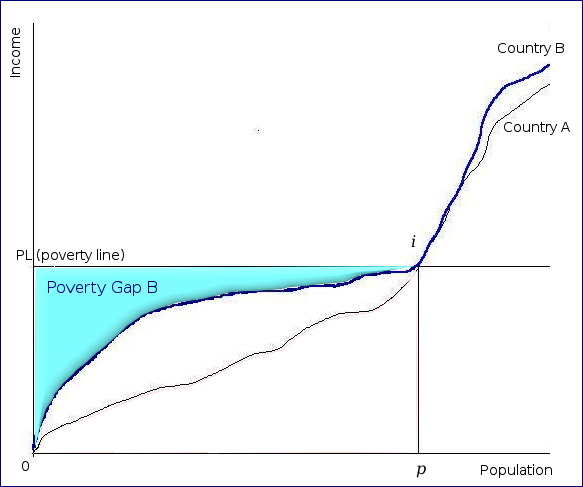
extent to which individuals on average fall below the poverty line, and expresses it as a percentage of the poverty line, or, in other words, the average difference between poor households' income and the poverty line.
poverty deficit, meaning that it would require a larger per capita amount of resources to bring all poor people above the poverty line.


inequality among the poor.
For Country C, Population N=5, Poverty level Pl=110.
| Country | PGI | |||||
|---|---|---|---|---|---|---|
| I (Income or expenditure) | 80 | 90 | 100 | 110 | 120 | |
| PG (Poverty gap, for PG ≥ 0) | 30 | 20 | 10 | 0 | 0 | |
| PG÷Pl | 0.273 | 0.182 | 0.091 | 0 | 0 | 0.11 |
| Total transfer (PGI×Pl×N) | 60 | |||||
PGI is the average of the individual PG÷Pl ratios (0.273+0.182+0.091+0+0=0.55÷5=0.11).
The total transfer required to bring all poor people up to the poverty line is simply the sum of all the poverty gaps in a population (30+20+10+0+0), or the multiplication of the country's poverty gap index by both the poverty line and the total number of individuals in the country (PGI×Pl×N).
| Country | Population below $1.9/day (%) | Poverty gap at $1.9/day (%) |
|---|---|---|
| Bangladesh | 43.7 | 11.2 |
| Benin | 53.1 | 19 |
| Burkina Faso | 55.3 | 19.9 |
| Burundi | 77.7 | 32.9 |
| Central African Republic | 66.3 | 33.1 |
| Chad | 38.4 | 15.3 |
| Congo, Dem. Rep. | 77.2 | 39.3 |
| Côte d'Ivoire | 29 | 10.3 |
| Gambia, The | 45.3 | 17.7 |
| Guinea | 35.3 | 10.3 |
| Guiné-Bissau | 67.1 | 30.5 |
| Haiti | 53.9 | 28.9 |
| Kenya | 33.6 | 11.7 |
| Lesotho | 59.7 | 31.8 |
| Liberia | 68.6 | 28.1 |
| Madagascar | 81.8 | 40.3 |
| Malawi | 70.9 | 33.3 |
| Mali | 49.3 | 15.2 |
| Micronesia, Fed. Sts. | 50.4 | 28.5 |
| Mozambique | 68.7 | 31.4 |
| Niger | 50.3 | 13.9 |
| Nigeria | 53.5 | 21.8 |
| Papua New Guinea | 39.3 | 15.9 |
| Rwanda | 60.3 | 23.7 |
| Senegal | 38 | 12.8 |
| Sierra Leone | 52.3 | 16.7 |
| Solomon Islands | 45.6 | 17.4 |
| St. Lucia | 35.8 | 13.2 |
| Suriname | 23.4 | 16.5 |
| Swaziland | 42 | 16.6 |
| Tanzania | 46.6 | 14.4 |
| Timor-Leste | 46.8 | 12.1 |
| Togo | 54.2 | 23.2 |
| Turkmenistan | 42.3 | 14.5 |
| Uganda | 33.2 | 10.1 |
| Uzbekistan | 66.8 | 25.3 |
| Zambia | 64.4 | 31.6 |
| ¹ Retrived from http://iresearch.worldbank.org/PovcalNet/index.htm?2, on 7 March 2016. | ||
Sources: Indicators for Monitoring the Millennium Development Goals. United Nations, New York. 2003. PovcalNet. World Bank, 2016.